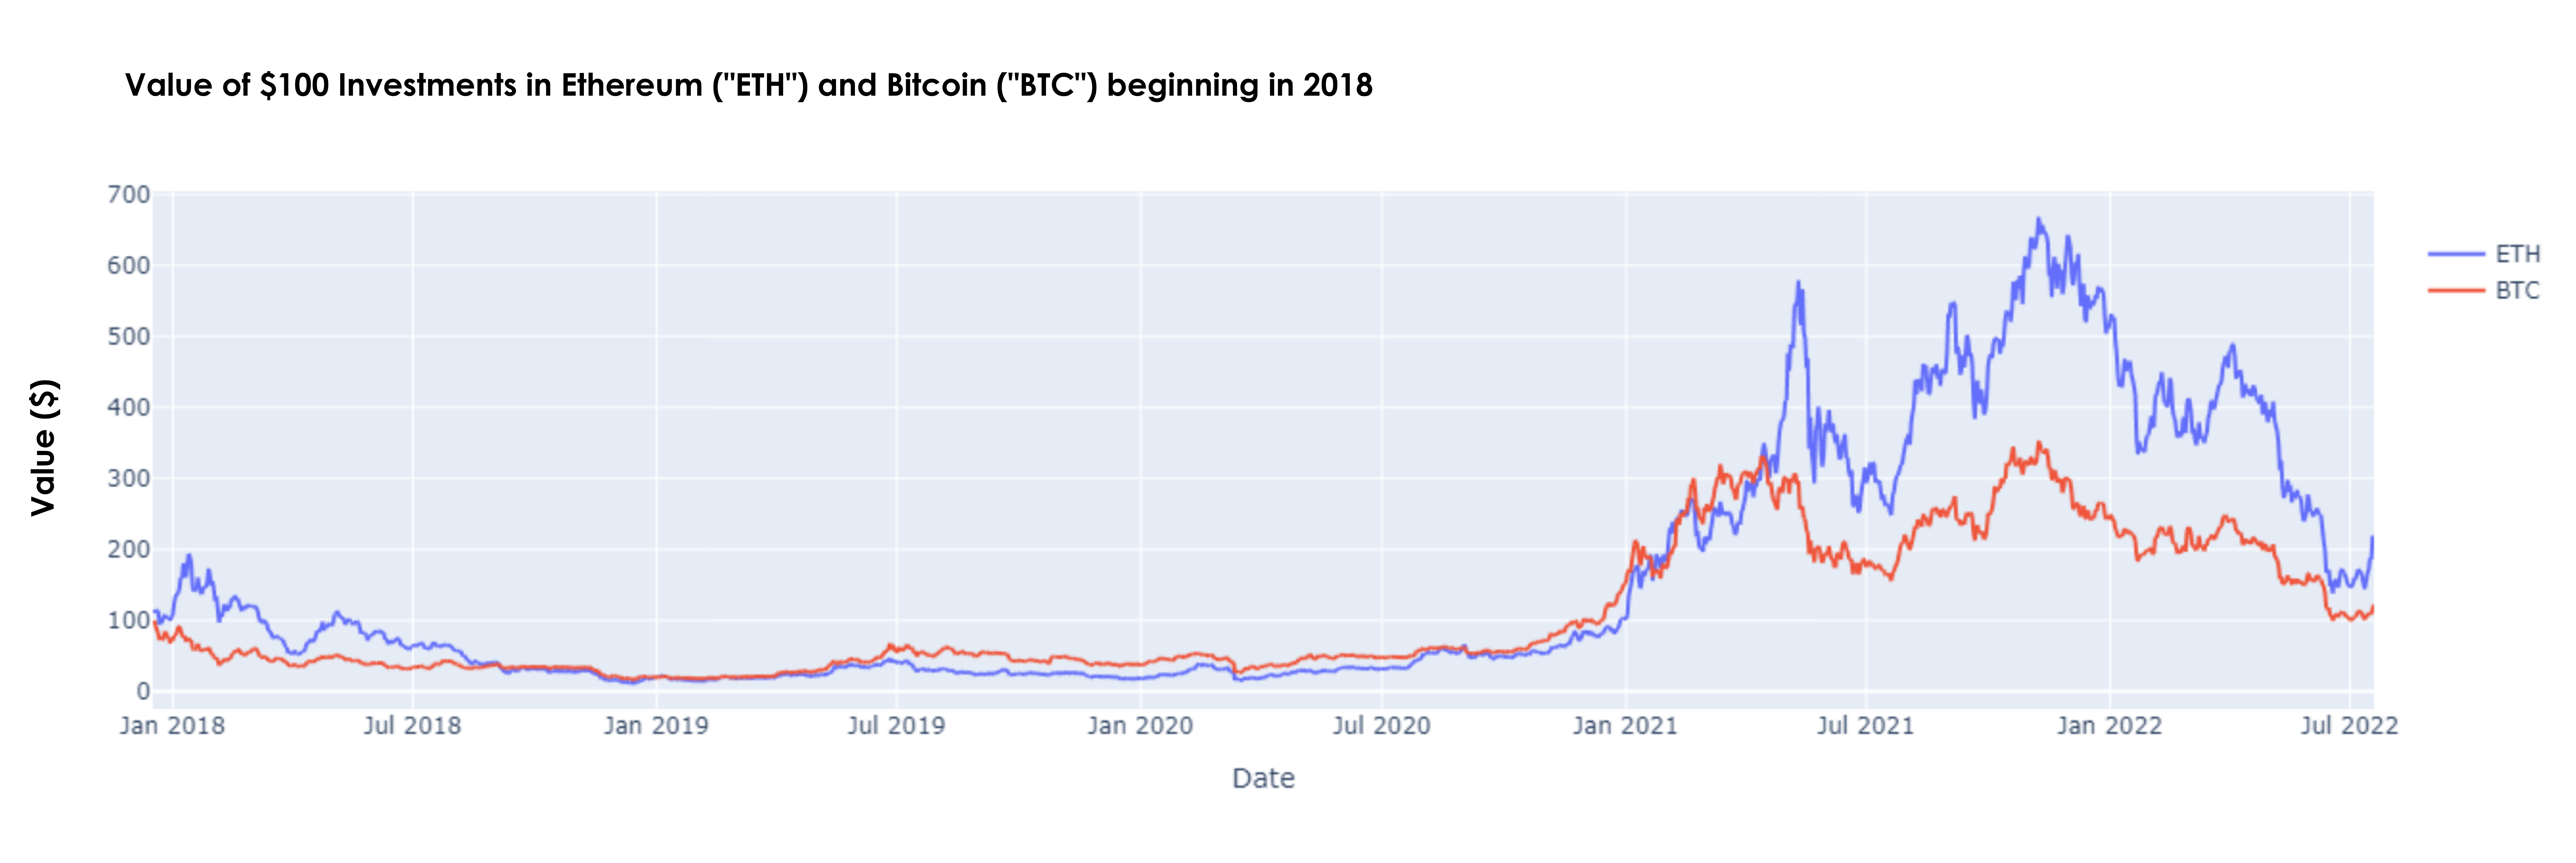
The rise and fall of crypto assets over the preceding two years adds another chapter to the nascent narrative of the crypto industry. Many investors now believe that crypto markets are in the midst of a ‘crypto winter,’ a term used to describe long periods of underwhelming performance. The boom-and-bust nature of crypto assets is not exclusive to the current period, but there are several unique aspects of the recent decline including crypto’s shifting relationship to macro-factors and the specific market dynamics that influenced price action in the latest cycle.
Impact of the Grayscale Bitcoin Trust:
With the launch of Grayscale’s Bitcoin Trust (“GBTC”) in 2015, there was an easy way for investors to gain bitcoin exposure with regulatory compliance. Demand for public market vehicles afforded GBTC a significant premium to the Net Asset Value (“NAV”) of the underlying bitcoin (“BTC”) holdings in the latter part of 2020. To capture this premium, institutions subscribed to the trust by depositing bitcoin with the intention of selling GBTC after the six-month lockup. This crowded NAV-arbitrage trade was a source of buying pressure for BTC up until mid-2021. When the lockups ended and institutions took profit on the trade, the premium fell fast. Competition from a new bitcoin ETF in Canada also contributed to the collapse of the GBTC premium. Since GBTC has no near-term mechanism for shareholders to redeem its bitcoin holdings, nothing prevented GBTC from sliding to a significant discount to NAV. The biggest hope for those seeking to cash out at NAV was Grayscale’s push to convert the trust to an ETF. However, the SEC shut down their bid, sending the discount even lower (28.7% as of writing).

The GBTC phenomenon contributed to Bitcoin’s upward and subsequent downward price movement in the latest cycle, creating fragility among some crypto institutions who leveraged the arbitrage trade (perhaps underestimating the potential for a steep discount). Then the TerraUSD stablecoin collapsed.
Terra/ LUNA Breakdown
TerraUSD (“UST”) was an algorithmic stablecoin that maintained a U.S. dollar peg by being redeemable for $1 worth of the ecosystem token LUNA. This simply means that each UST token was supposed to be priced at 1 U.S. dollar at all times (or very close to it). If the UST price fell below $1, arbitrageurs could purchase UST at the lower price and trade it for $1 worth of LUNA, therefore profiting from the spread. Similarly, when UST traded above $1, arbitrageurs could exchange LUNA for UST. This mechanism kept the UST price very close to $1 for a while, but it only worked so long as investors believed it would work.
Algorithmic stablecoins have a long history of failed experiments with break downs in their economic assumptions. However, subsequent designs attempt to improve upon the shortcomings of previous iterations. Some thought Terra had solved the puzzle as LUNA quickly grew to a market capitalization of over $30 billion (a top-10 cryptocurrency by market capitalization). Still, others noticed red-flags and vulnerabilities.
The primary demand for UST was driven by Anchor, a decentralized lending platform which offered a whopping 19.5% annual return for depositing UST. In fact, of the $18 billion total supply of UST, $16 billion was deposited in Anchor— the first strong indicator that the system was fragile. Where was this yield coming from? Borrowers only paid around 10% APR on their loans, and they were scarce compared to depositors. Anchor’s cash inflow at the end of April was about $0.7 billion while its cash outflow for UST deposits was about $2.6 billion. Some more yield was sourced from transaction fees. Still, most of the difference had to be supplied by depleting Terra’s reserve funds. In other words, the yield was not sustainable without net inflows.
A 20% annual return for simply holding a US-dollars-equivalent would in principle attract any investor. It therefore isn’t surprising that this return proved to have associated risk. Yield in crypto usually comes from four sources: pooling tokens together to provide the market with liquidity, lending and borrowing, staking, or temporary reserves (as was the case with Terra). With DeFi, anyone can easily (and perhaps unwittingly) gain exposure to complex instruments and market activities such as arbitrage, market-making, and lending. Traditionally these activities are reserved for sophisticated firms within a regulatory framework[1] (and even they can collapse when risk is not managed properly). While everything crypto carries significant risks at this stage, carefully examining the points-of-failure and being aware of the pitfalls of prior DeFi experiments can help evaluate the trade-offs and determine if capturing the risk-premia is worthwhile for a given tolerance.
An apt comparison to the TerraUSD de-pegging is what happened to supposedly safe money market mutual funds in 2008 when the Reserve Primary Fund broke its dollar peg. It became unable to meet redemption requests due to exposure to Lehman Brothers’ short-term loans as worried investors rushed to pull from the fund. Theoretically, this sort of risk is mitigated, because, as a decentralized platform, the cash flows of Anchor are executed automatically. The near-instant arbitrage capability of the cryptocurrency should also provide some stability. However, crypto-specific dynamics also created more risks. In practice, perfect arbitrage was limited by a percentage fee when redeeming LUNA for UST. This was typically set at 2 percent, but it was designed to increase exponentially when traders redeemed more LUNA than a set redemption capacity. The purpose of this mechanism was to encourage trading LUNA on secondary markets so there would be greater external liquidity. However, semi-reliance on these markets to round-out the arbitrage meant a reliance on their liquidity.
Liquidity fragmentation and opportunistic traders
In crypto, liquidity is fragmented across many centralized exchanges, networks, and decentralized automated market makers (“AMMs”). This enables relatively small capital to greatly influence price in certain situations. The liquidity is also publicly visible—everyone can see when it’s lacking. At the exact moment when the Terra team temporarily withdrew a significant amount of liquidity on Curve (the largest stablecoin AMM) to reallocate it to a new pool, a trader sold 85 million UST on the Curve pool. Along with 6 large wallets which followed (either selling UST or removing liquidity from the pool), this catalyst was enough to briefly break the peg. On-chain data suggests the trades were pre-planned, as huge amounts of UST were transferred from Terra to Ethereum compared to the daily average prior to the event; an increase led entirely by 10 large wallets.
Another 200 million UST was spontaneously sold on the Binance exchange. The dollar peg was only slightly broken at this point, but this sparked fear and uncertainty— UST was rapidly pulled from Anchor (9 billion of 14 billion was withdrawn in 48 hours) and LUNA’s price fell over 50%. If the LUNA market-cap fell below UST, UST could not hope to be redeemed for fair value. In an attempt to prevent this total-collapse threshold from being reached, the Terra organization sold over 80,000 reserve BTC, which contributed to a broader crypto-meltdown — but it wasn’t enough. To compound the issue, a free-fall LUNA price made it possible for malicious actors to abuse the proof-of-stake consensus mechanism and manipulate transactions as good-faith validators represented less capital in dollar terms (or fled the falling token). Therefore, Terra was forced to halt the chain entirely.
The contagion of the collapse led to a cascade of liquidations and margin calls that dried-up liquidity and made some firms insolvent— and segued into another de-peg that made matters even worse.
Staked Ethereum and GBTC Déjà vu
Lido’s stETH is a popular derivative of Ethereum (“ETH”), and the two historically maintained a 1:1 price ratio. With Terra’s collapse, insolvency and capital constraints depleted the available stETH liquidity. Meanwhile as people fled Terra’s ecosystem, large quantities of stETH that were deposited in Anchor were bridged back to the Ethereum network in a matter of days. Amidst general uncertainty and loss of Anchor’s yield incentive, selling pressure mounted on stETH (in excess of ordinary ETH). Because stETH cannot yet be directly redeemed for ETH, there was no arbitrage to defend the peg.
As stETH fell relative to ETH, leveraged traders who assumed stETH would remain roughly 1:1 with ETH were forced to liquidate their positions (creating a flywheel of sell-pressure).
This interconnected chain of events has exposed the overleveraged risk-taking of many of the largest centralized cryptocurrency institutions who now face insolvency (reminiscent of Lehman-brothers). And their retail customers may never get their funds back. In contrast, the blue-chip decentralized protocols like Aave, Compound, MakerDAO, and Uniswap have maintained flawless 24/7 functionality irrespective of market conditions— a testament to the reliability of the automated infrastructure.
The fact that much of the sell-pressure has been related to excess leverage could actually provide comfort to crypto bulls. Fundamental innovation and network effects remain intact, so perhaps the true demand is temporarily underrepresented in price. However, macro-concerns remain.
Crypto’s Shifting Relationship to Macro Factors
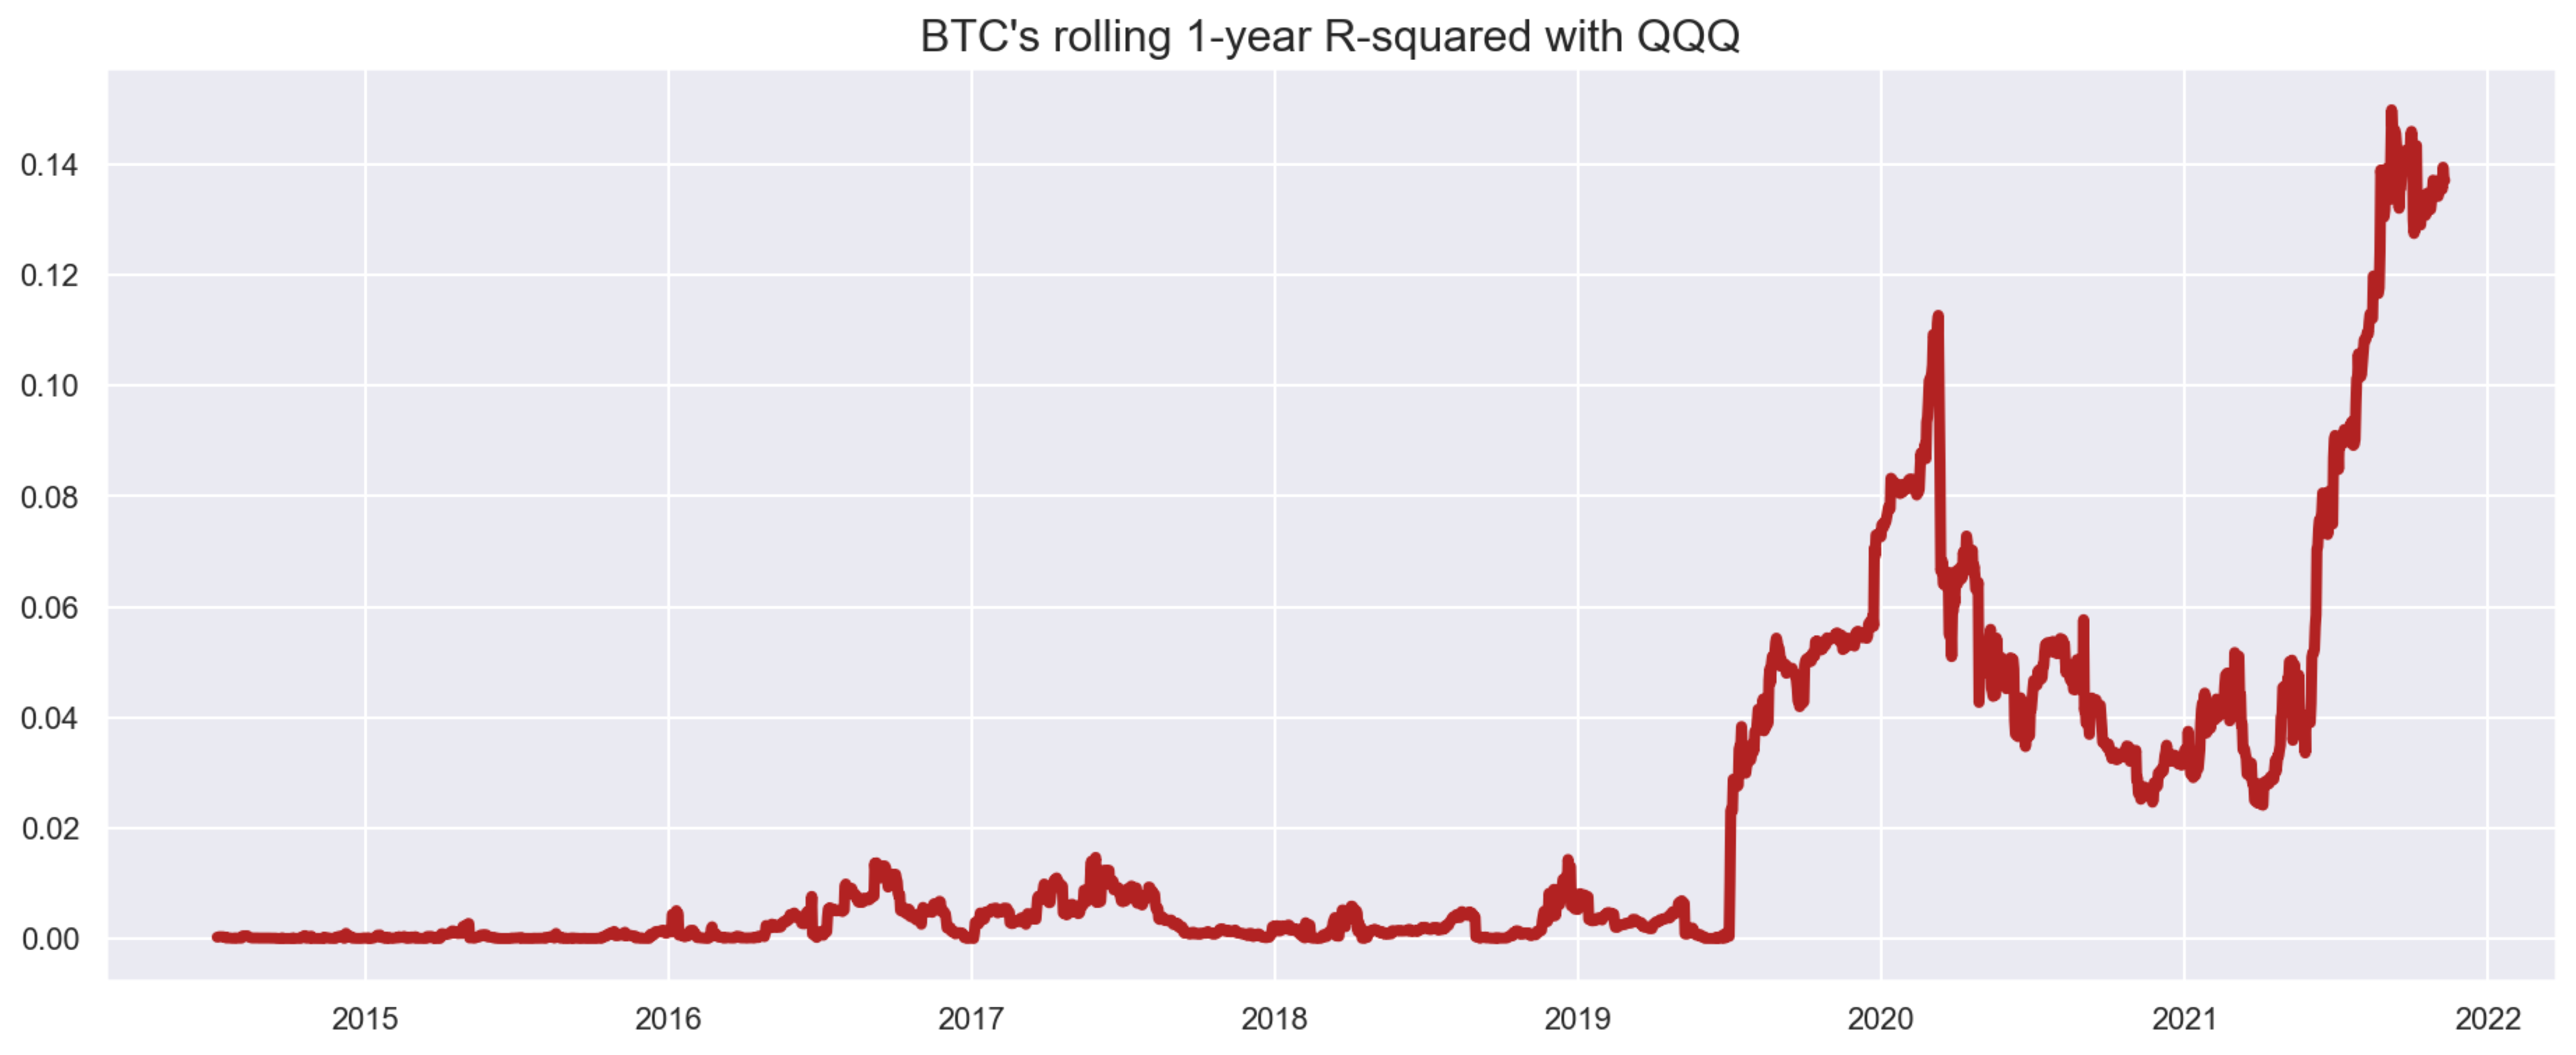
According to Shapeshift[2] founder Eric Voorhees, “this is the first crypto crash which is clearly… a result of macro factors.” However, the crypto-specific events described above certainly fueled the fire. According to the long running crypto hedge fund Pantera Capital— fundamentally “there really isn’t a reason that Bitcoin needs to be a risk asset correlated thing.” Recently, Bitcoin has performed more like a high-beta stock than ever before— a far cry from digital gold.
Note the uptick in the R-squared[3] of Bitcoin and the Nasdaq 100 Index (QQQ):

Historically, bitcoin’s correlation with stocks is elevated during major S&P 500 downturns. However, this time the relationship is much stronger and has persisted for longer than usual.
Key factors contribute to making this period unique (from the downturns of 2014, 2018, and 2020):
If federal reserve policy induces a period of lower growth for traditional assets, it could be an opportunity for crypto to prove its value as a counter-cyclical forward-looking investment opportunity. Or are the current correlations more of a lasting trend?
[1] See our previous blog post “Developments in the US Regulatory Environment for Cryptocurrencies”
[2] ShapeShift is a non-custodial cryptocurrency exchange founded in 2014 that open sourced all code and fully dissolved its corporate structure in 2021, transitioning to a decentralized community-owned and governed platform.
[3] R–squared is a statistical measure that, in this case, represents the proportion of the variance of BTC’s returns that is explained by QQQ returns. The value can range from 0 to 1 with higher values indicating a stronger relationship.
The views expressed represent the opinion of Passage Global Capital Management, LLC. The views are subject to change and are not intended as a forecast or guarantee of future results. This material is for informational purposes only. It does not constitute as investment advice and is not intended as an endorsement of any specific investment. Stated information is derived from proprietary and nonproprietary sources that have not been independently verified for accuracy or completeness. While Passage Global Capital Management, LLC believes the information to be accurate and reliable, we do not claim or have responsibility for its completeness, accuracy, or reliability. Statements of future expectations, estimates, projections, and other forward-looking statements are based on available information and Passage Global Capital Management, LLC’s views as of the time of these statements. Accordingly, such statements are inherently speculative as they are based on assumption that may involve known and unknown risks and uncertainties. Actual results, performance or events may differ materially from those expressed or implied in such statements.