Categories
Uncategorized

Demystifying Position Sizing: A Dive into Probabilities, Payoffs, and Risk Management

Statistician and Black Swan author Nassim Taleb said “if you gave an investor the next day’s news 24 hours in advance, he would go bust in less than a year.” Taleb is implying that even with an informational advantage, investors must properly manage their risk. The feeling of having an edge, be it real or perceived, tends to lead investors to overconcentrate their bets. This type of behavior has been shown in behavioral experiments with simple mathematical solutions. In one study,[1]  participants were given a biased coin with a 60% chance of a flip landing on heads. They were given $25 and were able to bet any size and configuration for thirty minutes. They would also be able to pocket any winnings, subject to a cap of $250. Given the large probabilistic advantage, the researchers expected the participants to do reasonably well. As Nassim Taleb probably would have expected, the results were shockingly underwhelming with 28% of participants going bust and 67% betting on tails at least once. With no upper limit on the amount one could win, 300 flips with the optimal bet size could have yielded an astonishing value of over $3 million in this game. Why did so many participants fail to earn anything and what could they have done differently to convert their advantage into wealth?

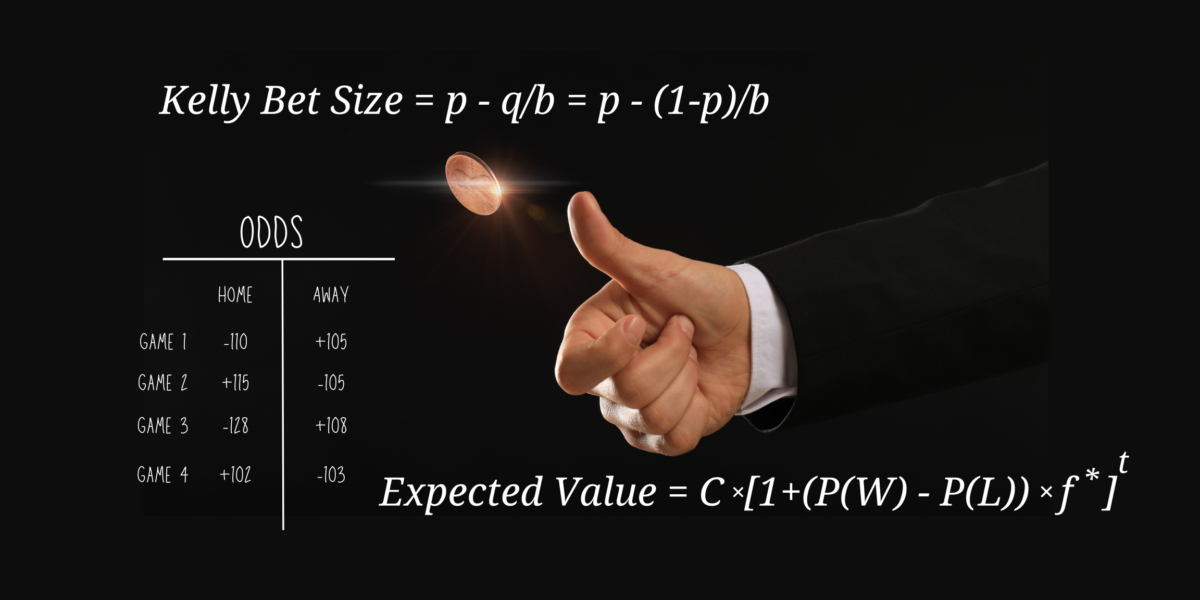
The aforementioned study is ultimately a challenge related to bet sizing. Mathematically, the optimal bet size for this problem is 20% of each participant’s “wealth.” This can be derived from the Kelly Criterion. The Kelly Criterion is a well-known formula for determining optimal bet size developed in 1956 by John L. Kelly, a scientist at AT&T Bell Laboratories. For a bet like a coin flip, where a negative outcome amounts to a total loss on the bet, the Kelly position size can be given by:


Kelly Bet Size = Probability of a Win – Probability of a Loss/ Fraction of Bet Gained with a Win


The expected value in this biased coin flip example is 0.6-0.4/1 = 0.2 on every dollar bet, or 20% of available wealth. The researchers point out that repeatedly betting a fixed 20% size gives a 95% chance of reaching the maximum payout of $250. Yet they found that participants frequently gambled everything on one bet and one third of participants ended with less money than they started with. This experiment shows that decisions around the allocation of funds are often sub-optimal. Heuristics like the Kelly Criterion can help investors to make rational decisions around position sizing and capital allocation.

The coin flip example is fairly straightforward: you have an advantage in knowing that heads is weighted to occur 60% of the time, and the payout will always match your bet, no matter which side you take. Thus, a rational player would always bet on heads, and with the correct position sizing, would have a fairly good chance to make substantial sums of money. Unfortunately, the real world is not so advantageous. Consider a pastime that has recently exploded in popularity due to regulatory changes: sports betting. Here, individual gamblers have no particular edge. In fact, they actually have a slight disadvantage since the sportsbook has to have their cut of the profits. To illustrate, we can examine the recent big football game between the Kansas City Chiefs and the San Francisco 49ers. Avid football fans already know the Chiefs won this game, but prior to the game, the odds had the 49ers favored at -128 and the Chiefs as underdogs at +108 according to CBS Sports. This strange notation simply relates to the profit received from a winning bet. To bet on the Niners and receive a $100 profit, bettors would need to wager $128. A $100 bet on the Chiefs would yield a profit of $108 in a Chiefs win. These payouts are based on probabilities which can be calculated as:


Implied Probability of a Win = Capital Risked/(Capital Risked + Potential Profit)


In this case, the implied probability of a 49ers win was 128/(128 + 100) = 56.14%. The probability of a Chiefs win was 100/(100 + 108) = 48.08%.[2] Using the Kelly Criterion with the market implied odds, the optimal bet size on the 49ers would be… 0%. Would a rational person bet on the 49ers then? The answer is: maybe. Suppose a person with superior football expertise who has performed deep analysis on the teams comes up with a 59% probability of the 49ers winning. With this increased win probability, our hypothetical gambler has an edge over the odds that the betting market is giving him. The Kelly Criterion now says that this gambler should bet 6.5% of his total capital on the 49ers. Of course, this presents two problems. First, our gambler could very well be wrong on his probability assumptions. That is, is he really smarter than the overall betting market? Second, as we now know, the Chiefs won. Despite a bet on the Niners being entirely rational, assuming our gambler’s probability estimates are correct, we are still dealing with probabilities. There is still a 41% chance that the bet will lose. This is why position sizing is so important. By only risking 6.5% percent of capital, our gambler can survive to keep making more bets and have a chance to gradually compound his winnings.

With this backdrop, there are several takeaways from these examples that can be applied to investing in financial markets. The first is that investing is a zero-sum game, much more closely represented by the sports betting scenario than the coin flip example. When an investor purchases an asset, there is always another party across the table selling the asset, similar to betting on the other team. Like sports betting, the asset will be priced according to market expectations. A rapidly growing company with solid underlying fundamentals will very likely trade at a higher valuation compared to a distressed company on the verge of bankruptcy. In financial theory, a higher valuation implies a lower expected return in the future. Conversely, a lower valuation would portend a higher expected future return. Of course, those return expectations come with extreme differences in risk. Investors are compensated, or given a premium, for taking on risk. What sort of payoff would you require to bet on the local high school junior varsity football team versus the 1985 Chicago Bears?[3]

A second takeaway is that the ability of investors to consistently outperform the markets ultimately depends on their ability to examine outcomes not in terms of certainties but in terms of probabilities, and investors must be able to convert those probabilities into rational position sizes given that financial markets contain high levels of uncertainty. Even the sports betting example above is ultimately too simplistic as it focuses on a single estimate of probability. Investors must instead recognize that outcomes are not binary; there are numerous scenarios which could play out, each with their own likelihood of being realized. When you add this uncertainty, the optimal bet size likely becomes smaller and begins to level off for larger bet sizes.
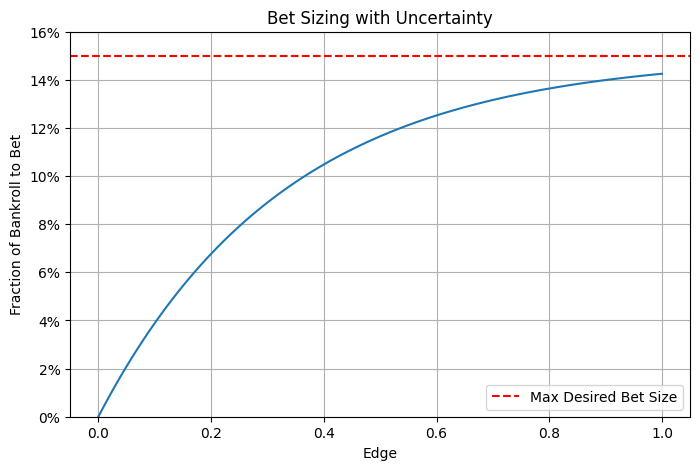
A hypothetical example with non-linear bet sizing. As the bet size becomes larger, the increase in bet size becomes smaller. In this case, the individual does not wish to bet more than 15% of capital on one bet, no matter the advantage they have (or think they have).


The final key takeaway is that investors must be aware of potential biases which could affect their decision-making. For example, in the example of the hypothetical gambler who believes his estimates are more accurate than the odds given by sportsbooks, one must ask if the gambler actually has an edge or if he is overconfident in his abilities. There is a reason the famed psychologist and Nobel Prize winner Daniel Kahneman called overconfidence “the most significant of the cognitive biases.” Similarly, it is challenging to beat the stock market consistently. Having a rigorous investment process in place can help to instill discipline and avoid overconcentrating in  too few positions.

An additional bias that could impact position sizing is loss aversion. The Kelly Criterion, for example, will give a rational position size for risk-neutral investors, but in reality, most investors are risk averse. This means losses have a larger psychological impact than gains. Suppose the Kelly Criterion indicates optimal position sizing of 20% of wealth. Someone starting with $100 may be very willing to risk $20, but an investor with $500,000 may not be willing to risk a daunting $100,000 on a single trade.  For this reason, it is common to see traders use a fraction of the optimal Kelly bet size to make the volatility more tolerable.

Ultimately, investors must consider expectations of both risk and return before translating investment opportunities into potential positions. Furthermore, systematically applying a heuristic such as the Kelly Criterion can help to determine appropriate position sizes, but the overall portfolio must also be a consideration. By just applying the Kelly Criterion to individual positions, the portfolio may be taking on much more risk than intended if the positions are highly correlated. Position sizing is a key driver of portfolio returns, and it is essential to ensure positions are sized not only to take full advantage of solid opportunities when they arise but also to ensure portfolio survival in the long run.


[1] Haghani, Victor and Dewey, Richard, Rational Decision-Making under Uncertainty: Observed Betting Patterns on a Biased Coin (October 19, 2016).

[2] Note that the sum of the alternative win probabilities exceeds 100% since the bets are priced to make money for the sportsbook, no matter who wins.

[3] The ’85 Bears are widely regarded as one of the best NFL teams of all time, scoring 456 points while only allowing 198 according to ESPN.


The views expressed represent the opinion of Passage Global Capital Management, LLC. The views are subject to change and are not intended as a forecast or guarantee of future results. This material is for informational purposes only. It does not constitute investment advice and is not intended as an endorsement of any specific investment. Stated information is derived from proprietary and nonproprietary sources that have not been independently verified for accuracy or completeness. While Passage Global Capital Management, LLC believes the information to be accurate and reliable, we do not claim or have responsibility for its completeness, accuracy, or reliability. Statements of future expectations, estimates, projections, and other forward-looking statements are based on available information and Passage Global Capital Management, LLC’s views as of the time of these statements. Accordingly, such statements are inherently speculative as they are based on assumptions that may involve known and unknown risks and uncertainties. Actual results, performance or events may differ materially from those expressed or implied in such statements.

Categories
Uncategorized

Market Corrections are Inevitable; Panic Selling Shouldn’t Be

Investors can quickly become panicked when they see the stock market experiencing a market correction, or even more daunting, entering bear market territory. The market recently experienced a correction, but these events are more common than one may think. Although the past is no guarantee of the future, over the last century, the market has recovered from drawdowns and provided higher gains for long-term investors. Market corrections are inevitable, and they are bound to happen multiple times during every investor’s life. It is easy to become negatively influenced and anxious during times of market turmoil, but rather than acting out of fear, learning the facts about similar events will provide you with a more encouraging mindset. Experienced investors are more likely to be well-informed on volatility and past market behaviors, so they are able to stay committed to their investment strategy. Having this beneficial knowledge will allow you to look past the discomfort more easily to avoid the urge to respond in a costly manner that you may later regret.

A major stock index, such as the S&P 500 or the DJIA, experiences a market correction when it falls more than 10%, but less than 20%, from a recent peak. When the decline exceeds 20%, the index enters bear market territory, which involves a higher degree of detrimental impact compared to a market correction. Market corrections are generally caused by current factors that disrupt the markets; these factors are typically temporary and quickly fade. On the contrary, bear markets are more likely to be the result of substantial imbalances that have built up over the years. These may coincide with recessions, defined as at least two consecutive quarters of decline in Gross Domestic Product (GDP), which is a measure of general economic health. Fortunately, bull markets generally last longer than bear markets and corrections. The average bull market lasts 8.9 years, whereas the average bear market lasts 1.4 years. Market corrections can be viewed as short-lived market setbacks that occur over a few months, and they are called “corrections” because the markets historically “correct” themselves where prices return to their longer-term trend. Market corrections are undeniably going to continue and affect most investors’ lives at some point. Many may find this frightening, but actually in a lot of cases, market corrections have acted as a healthy reset for investor expectations and stock valuations.

Overall, predicting stock market behavior is beyond difficult, and if incorrect, an investor may experience tremendous opportunity cost. Educated investors know that time in the market beats trying to time the market. To corroborate this point, a research study1 from J.P. Morgan found that “investors who missed the top 10 trading days during a recent 20-year stretch would have seen their returns fall by almost half, compared to those who stayed invested the whole time.” It is accurate to conclude that market corrections may damage short-term investors, but for long-term investors, they often provide buying opportunities. Times as this cause discomfort, but it is normal. Investors have to “pay to play”, and sometimes that means going through short-term discomfort to experience long-term success.

Financial markets kicked off 2022 with turmoil, where the economy is encountering a rise in geopolitical tensions, a four-decade high inflation rate, COVID-19 impacts, and interest rate hikes from the Fed – to name a few headwinds. The last factor is critical. The majority of market corrections happen during rate hiking cycles. Of course, the dynamic between the Fed Funds rate, economy, and stock market is complicated and may be different across cycles. So far this year, all three major stock market indexes, the S&P 500, the Dow Jones Industrial Average, and the tech-heavy NASDAQ, suffered corrections with the latter entering bear-market territory. However, the discomfort of market underperformance today may be softened for the average investor due to a tight labor market and strong consumer balance sheets. Additionally, market performance is ultimately driven by fundamentals such as corporate revenue and earnings. For 2022, investors will continue to stay up to date on a variety of risk factors including the Fed monetary policy, consumer spending, COVID-19, and the Russia-Ukraine crisis, but the most alarming of all is the persistently high inflation rate. Although markets do move faster than they have in the past, we can analyze past market corrections to get a better understanding of how the market may behave in the future.

Since 1950, there have been approximately 39 market corrections.2 The stock market does not follow the pattern of averages, but to put it in perspective, that is equivalent to a double-digit decline occurring in the S&P about every 1.85 years. On average, a stock market correction will take 6 months to reach its trough. 7 of those corrections took more than a year to reach its bottom, and 24 of them took approximately 3.5 months. Additionally, 6 of these 39 corrections occurred in the 2010’s. However, over the 2010 decade, the S&P 500 received a total return of about 256%; this alone proves how the market rebounded and rewarded investors who stuck it out with outstanding gains. Another example is 2018, when the S&P 500 plummeted more than 10% in the first and fourth quarter. This was abruptly followed by a rebound of over 13% in the first quarter of 2019. In the bear market between 2007 and 2009, the S&P 500 declined over 48%. On a brighter note, the S&P 500 was up 68.6% from the low point one year later and up a total of 95.4% 2 years later. Market corrections are actually extremely common. When looking at 2002 through 2021, there has been a decline of more than 10% in 10 of those 20 years – or 50% of the time. In 2 other years in that timeline, the decline was very close to 10%. Even though the markets experienced these deep falls from 2002 to 2021, they rose and provided positive returns in all but 3 years. A report from Crestmont Research3 looked into the years of 1919 to 2021 to analyze the rolling 20-year average annual total returns. The results are optimistic, as it was found that the “S&P 500 always made money for investors on a total-return basis if they held for at least 20 years”. Out of all these years, only 2 of them ended with an average annual total return of less than 5%, and more than 40 of those years ended between 10.8% and 17.1%. Furthermore, we can examine how the market tends to perform after exiting the market correction. Using data beginning in 1928, the S&P 500 had an average gain of nearly 14% one year after a market correction. One of the quickest and deepest corrections was during COVID-19, but this was also one of the speediest recoveries. In the span of a few weeks, the S&P 500 lost 30%, but it then regained all of that loss within 5 months. Within one year following the bottom of this correction, the value of the S&P 500 doubled. This example, as well as all the others, prove that market corrections are common, and that investors should avoid attempting to “fix” the correction. As mentioned, panic moves will lock in your losses and you will lose out on the future gains from recovery. Investors can benefit from understanding these historical tendencies. The market has volatility and times such as this are normal, so it is important for long-term investors to remain confident in their investment strategy.


1 Azzarello, Samantha and Roy, Katherine. “Impact of being out of the market.” J.P. Morgan Asset Management, 5 June 2020.

2 Williams, Sean. “How Long Do Stock Market Corrections Last?” The Motley Fool, 20 March 2022.

3 “Returns Over 20-Year Periods Vary Significantly; Affected by the Starting P/E Ratio.” Crestmont Research. 2022.


The views expressed represent the opinion of Passage Global Capital Management, LLC. The views are subject to change and are not intended as a forecast or guarantee of future results. This material is for informational purposes only. It does not constitute as investment advice and is not intended as an endorsement of any specific investment. Stated information is derived from proprietary and nonproprietary sources that have not been independently verified for accuracy or completeness. While Passage Global Capital Management, LLC believes the information to be accurate and reliable, we do not claim or have responsibility for its completeness, accuracy, or reliability. Statements of future expectations, estimates, projections, and other forward-looking statements are based on available information and Passage Global Capital Management, LLC’s views as of the time of these statements. Accordingly, such statements are inherently speculative as they are based on assumption that may involve known and unknown risks and uncertainties. Actual results, performance or events may differ materially from those expressed or implied in such statements.

Categories
Uncategorized

Rising Rates and Risk Measurements

Inflation has reached a 40-year high with consumer prices and wages reaching excessive levels, competing in a wage-price spiral. With inflation running well above the 2% target, 2022 will consist of the Federal Reserve fighting for their credibility. It is anticipated that the Fed will raise interest rates at consecutive policy meetings for the first time since 2006, and a half-percentage-point increase, which has not been done since 2000, has not been fully ruled out. Some investors are fearful that Fed Chairman Jerome Powell will lead the economy into a recession in the effort to quell inflation. The Fed hasn’t had to combat inflation of this magnitude since the 1980’s, and historically when inflation has been this high, the Fed has not been able to push it down without a subsequent recession. Even with the Fed’s efforts, inflation may remain high due to factors outside of the Fed’s control, such as worsened shipping delays and supply chain issues from the pandemic. As an investor, it is critical to have an experienced portfolio manager guiding your investments. Portfolio managers must implement risk management techniques to evaluate the potential impact that these negative events can have on your portfolio, and to ensure that you are not exceeding your desired risk tolerance. Risk measurements and models, including VaR, modified versions of VaR, scenario analysis, and stress testing can provide insights focused on these concerns.

Skillful portfolio managers may utilize risk models in combination with their judgement to exploit the strengths and limitations of your portfolio. VaR, or value at risk, is the minimum loss of portfolio value that would be expected to occur a specific percentage of the time over a certain period of time. This is easier to understand with an example. A 5% daily VaR of $1,000 would mean that on 5% of days, a portfolio is expected to lose at least $1,000.  Portfolio managers have the flexibility to choose the best  percentage threshold and time horizon (e.g., daily, monthly, yearly, etc.) to meet their requirements.

An effective portfolio manager must understand the advantages of VaR, but also its limitations. VaR is a simple, yet valuable risk measure that allows one to see the potential losses that can danger a portfolio. There is a substantial amount of information shown in a single number. This number can provide a basis for risk comparison across asset classes and portfolios to see where the majority of risk is emanated from. This allows a portfolio manager to see adjustments they may need to make to realign its VaR, or they may realize that a reallocation of the portfolio is necessary. Although useful, VaR does require discretionary choices, such as choosing the data sources. There also may be more extreme, “left-tail events” that occur which VaR may not capture. VaR also has difficulty taking illiquid assets into account and is often understated for these assets. It is also important to understand that VaR does not portray the worst-case scenario and that losses can exceed it. It is also sensitive to correlation risk. Correlation risk is the risk that when markets are under extreme stress, correlations among assets tend to rise which can significantly decrease diversification benefits in a portfolio. VaR can be oversimplified, and these limitations are not unique to this specific risk measure. However, if a portfolio manager fully understands this, they can still receive valuable information. Rather than using VaR by itself, risk management is most effective with a combination of risk measurements and models.

A portfolio manager cannot obtain all the necessary information through one single risk measure; there are numerous variations of VaR that aim to provide additional information where VaR lacks. CVaR, also referred to as conditional VaR, expected tail loss, or expected shortfall, represents the average loss that would occur in the left tail of the distribution whereas traditional VaR only represents the minimum loss. For example, consider the aforementioned portfolio with a 5% VaR of $1,000. The CVaR of this portfolio will be more than $1,000. VaR represents the minimum loss on the worst 5% of days whereas CVaR represents the average loss on those same days. CVaR can be more useful to a portfolio manager than VaR since it captures more information about the extreme left tail of the distribution. IVaR, or incremental VaR, determines how the VaR will change if a certain position size in the portfolio is altered relative to the other positions or if a position is added or removed. If a portfolio manager wants to increase a holding in the portfolio, they would recalculate the VaR under the assumption that this change has been made. The IVaR is calculated by finding the difference between the before VaR and the after VaR, which reflects how VaR is affected due to this certain change. A portfolio manager can compare the new VaR, whether it is higher or lower, and make any changes they see as beneficial for the portfolio. MVaR, or marginal VaR, can be used to determine how each asset contributes to the VaR; it measures the change in VaR when a very small alteration is made in a portfolio position. Although IVaR and MVaR are both risk measurements that determine the impact of an anticipated change, MVaR is more focused on smaller changes within the portfolio. The last variation of VaR is the ex-ante tracking error, also known as relative VaR. The ex-ante tracking error delineates the degree to which the performance of a portfolio may deviate from its benchmark. Although VaR and its variations support the risk management process, a portfolio manager must also understand the factors that are driving the risk.

Scenario analysis and stress testing can allow portfolio managers to analyze the risk drivers and address the shortcomings of other probabilistic risk measures. A scenario analysis can look at any event and evaluate how a portfolio may perform under these conditions. This risk model has two different methods: historical and hypothetical. A historical scenario analysis looks at what the return on a portfolio would be if a repeat of an event in history, such as The Great Inflation, were to occur. To determine this return, the value of each portfolio position is calculated before and after the changes to see the effect. This analysis can be run over a timeline to include different actions the portfolio manager may make throughout this event to alleviate the potential repercussions. Alternately, a stress test allows the portfolio manager to change multiple variables at once. This allows a portfolio manager to apply extreme, negative stress to a portfolio and assess the impact. This is a productive way to reflect on the impact that certain adverse market movements may have on a portfolio. However, it is unlikely that a historical event would happen in the exact way that it once did. The solution to this is a hypothetical scenario analysis, where one can evaluate the impact of an event that has not previously occurred on an investment portfolio. To construct a reliable hypothetical scenario, one must complete a reverse stress test, which involves targeting exposures to determine how they behave in different environments. Scenario analysis and stress testing provide an opportunity to review the potential impact from events and to understand the risk exposures. There is no certainty to how the markets will behave, and hypothetical scenario analysis, in combination with the other risk measurements, can provide a portfolio manager with a framework to best prepare for varying market conditions.


The views expressed represent the opinion of Passage Global Capital Management, LLC. The views are subject to change and are not intended as a forecast or guarantee of future results. This material is for informational purposes only. It does not constitute as investment advice and is not intended as an endorsement of any specific investment. Stated information is derived from proprietary and nonproprietary sources that have not been independently verified for accuracy or completeness. While Passage Global Capital Management, LLC believes the information to be accurate and reliable, we do not claim or have responsibility for its completeness, accuracy, or reliability. Statements of future expectations, estimates, projections, and other forward-looking statements are based on available information and Passage Global Capital Management, LLC’s views as of the time of these statements. Accordingly, such statements are inherently speculative as they are based on assumption that may involve known and unknown risks and uncertainties. Actual results, performance or events may differ materially from those expressed or implied in such statements.

Categories
Uncategorized

Compounding the Issue

“Compound interest is the eighth wonder of the world. He who understands it, earns it. He who doesn’t, pays it.”

– Albert Einstein

The most important concept pertinent to investing is the arithmetic of compounding. The math is not immediately intuitive, but the effects, both positive and negative, have momentous impacts on portfolio returns. Investors who understand the drivers of compounding are best positioned for long-term success. Alternately, nearsighted investors who ignore the significance of compounding may struggle to reach their desired objectives.

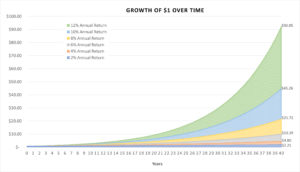
Much has already been written about the importance of long-term investing, but the specific reason why it is essential to retain a long-term mindset often goes overlooked. It is easy to believe that stock market riches lie in huge overnight gains, especially after the GameStop incident earlier this year. The firestorm of media coverage surrounding these events can easily induce investors to subconsciously overestimate the frequency of such occurrences. However, in reality, patient investors have a much better chance of reaching “riches” in the stock market due to the exponential growth of compounding over time. Suppose an investment returns 10% per year. After ten years, each dollar invested would be worth $2.59. After twenty years, each dollar would be $6.72. After 30 years, each dollar would be $17.45. It is evident that the growth is not linear; it is exponential. Each incremental  increase in portfolio value leads to larger changes in the future.


Exhibit I: Exponential growth of portfolio for differing return assumptions.

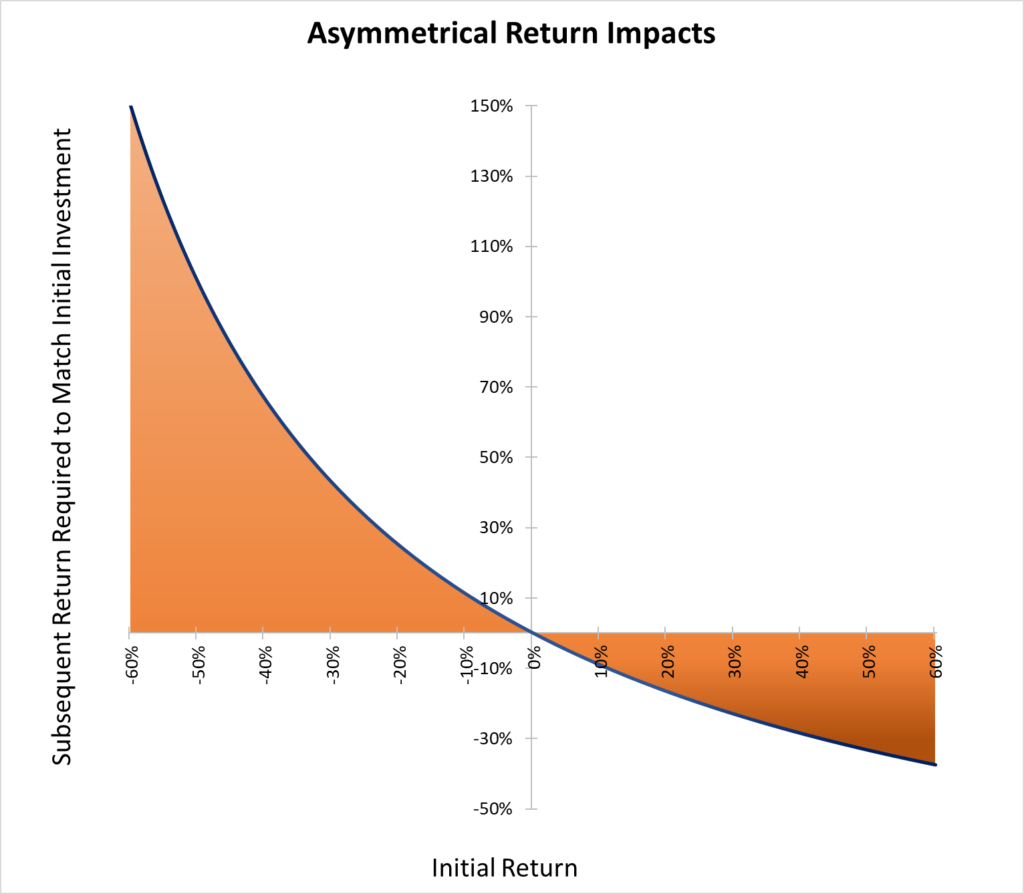
Despite the benefits, compounding can also have tremendously adverse consequences for investors. The effects of positive and negative returns are asymmetrical, meaning negative returns actually have a larger impact on the portfolio in dollar terms than positive returns of the same percentage. To illustrate, consider an investment of $1 million. After undergoing a rough period in the market, the value of the investment is now $500,000, for a 50% loss. However, we cannot simply rely on a 50% gain to bring the investment back to $1 million. Now that the value is only $500,000, we must double our money for a 100% gain in order to get back to where we started.

Exhibit II: If an investment returns an initial amount shown on the x-axis, what subsequent return needs to be achieved in order to match the starting dollar amount?

The question then becomes how investors can use compounding to their advantage rather than fall prey to unfavorable outcomes. Risk management and investor temperament are crucial. Risk is unavoidable. However, the amount of risk that is being taken must be carefully measured and monitored to ensure that it is not out of line with what the investor can tolerate. Investment professionals typically measure risk by volatility, or standard deviation. High volatility implies a magnitude of returns higher than historical tendencies would estimate. Note that magnitude says nothing about direction. It is not necessary that volatility will ultimately result in harm to an investors’ portfolio since volatility does not imply permanent loss; it only implies wide swings in value. However, when investor behavior is involved, volatility can easily result in permanent loss. This is especially true if it turns out that the portfolio risk was not properly managed or was more than the investor’s risk tolerance could allow for. The investor may panic and sell, foregoing potential high volatility gains in the recovery. Over the long-term the impact of these mistakes can be devastating even though the true impact might not be clear on the surface. The reason: compounding. The investor is missing out on the largest gains of the recovery, and when they do eventually get back in, their portfolio is starting from a lower value. Investors would be wise to follow Charlie Munger’s first rule of compounding: “Never interrupt it unnecessarily.”

Of course, the caveat to Munger’s quote is the word, “unnecessarily.” Just as investors can fall into the trap of panic selling, they may be influenced by the disposition effect. The disposition effect is a behavioral anomaly referring to investors’ natural tendencies to sell assets that have risen in price (thus locking in gains) and hold onto assets that have fallen (thus avoiding the aforementioned permanent loss). Each situation is different, and there is no clear answer on how to act. To maximize the probability of success over the long-term, it is vital for investors to have an investment process that they follow with discipline. This can help minimize the influence of emotions and allow their investments to compound over time.

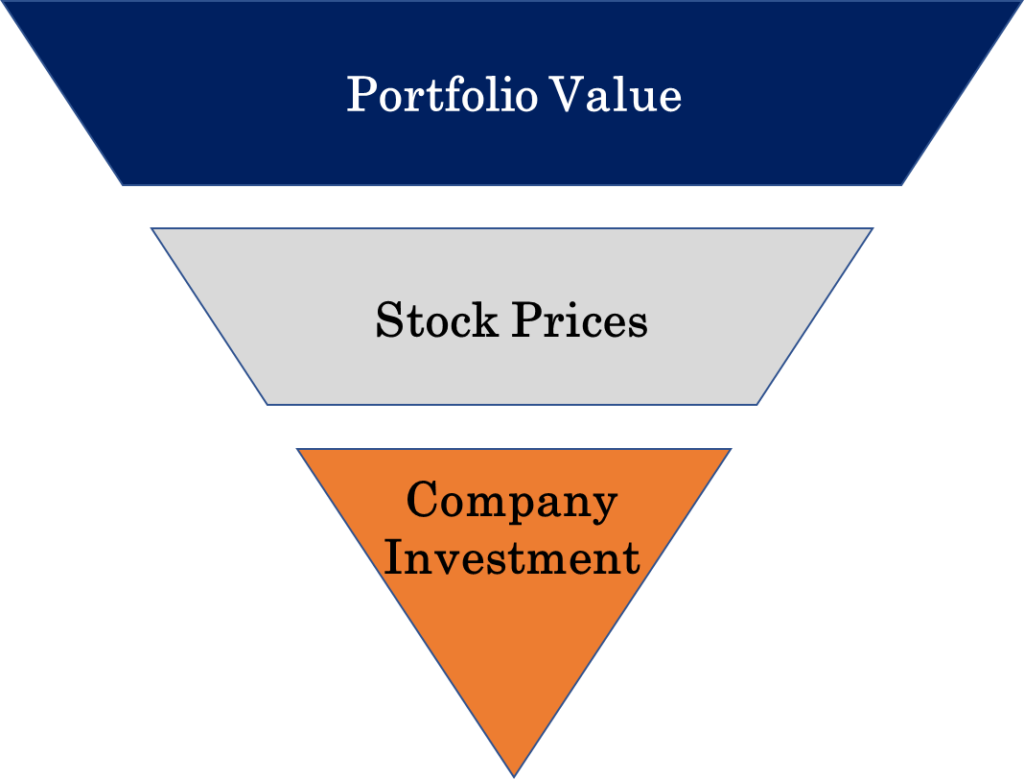
Compounding, as it relates to investing, occurs at multiple levels. At the highest level is the compounding of the portfolio value. This is not only related to the individual performance of the underlying securities but also how the portfolio is constructed and how drawdowns are managed (drawdowns are the losses of the portfolio from peak to valley). Diversification is imperative for reducing portfolio risk. The bellwether for diversification is the balanced portfolio consisting of stocks and bonds. Historically, the correlation between stocks and bonds has been low. This has allowed the two asset classes to perform particularly well together and lessen the volatility as compared to an all-stock portfolio. There are also more complex strategies that can be used. Hedge funds are well known for their focus on risk mitigation. Many hedge funds employ long-short strategies where they bet on certain stocks and against others. The offsetting positions, they hope, will minimize the systematic (market) risk and allow the fund to grow steadily despite market conditions (depending on the specific strategy; there are many variations of the long-short portfolio). These are only a few examples, but there are numerous types of strategies with the same aim: achieving steady returns and avoiding significant drawdowns to maximize portfolio growth over time.

The second level of compounding occurs at the individual stock price level. Famed mutual fund manager Peter Lynch popularized the term “tenbagger” to describe stocks that increase ten-fold over the initial buy price. Many investors focus specifically on seeking out these kinds of stocks. Needless to say, tenbaggers are rarities, but not every stock needs to be a tenbagger for an investment to be considered a success. Some investors may even find success through trading stocks over short time horizons (e.g., weeks, days, seconds, etc.). Renaissance Technologies’ Medallion Fund is the quintessential example. The quantitative hedge fund (which is now closed to the public) is believed to have achieved an astonishing average annual return of 66% gross of fees from 1988 to 2018 according to author Gregory Zuckerman. This was done by consistently generating small gains and using a fair amount of leverage in a large portfolio of securities. Due to the mathematics of compounding, these small gains do not simply add up over time; they multiply, which can result in staggering numbers.

Exhibit III: Compounding should  not be treated as some abstract mathematical mirage. Investors should understand how compounding occurs at multiple levels and directly affects value over time.


Disclaimer

The views expressed represent the opinion of Passage Global Capital Management, LLC. The views are subject to change and are not intended as a forecast or guarantee of future results. This material is for informational purposes only. It does not constitute investment advice and is not intended as an endorsement of any specific investment. Stated information is derived from proprietary and nonproprietary sources that have not been independently verified for accuracy or completeness. While Passage Global Capital Management, LLC believes the information to be accurate and reliable, we do not claim or have responsibility for its completeness, accuracy, or reliability. Statements of future expectations, estimates, projections, and other forward-looking statements are based on available information and Passage Global Capital Management, LLC’s views as of the time of these statements. Accordingly, such statements are inherently speculative as they are based on assumptions that may involve known and unknown risks and uncertainties. Actual results, performance, or events may differ materially from those expressed or implied in such statements.

Categories
Uncategorized

Systematic Crises & Managing Risk

Effective risk management is essential to successful investing. There are numerous sources of risk that can affect stocks, bonds, and other financial assets. One of the most dangerous is systemic risk. This involves a domino effect in which one sector, or even company, becomes a hazard to the entire financial system and global economy. The best example is the 2008 financial crisis in which the housing bubble burst and large banks holding low-quality mortgage debt suffered huge losses. This was the catalyst for tightening credit spreads, plummeting stock markets, soaring unemployment rates, a global recession, and severely damaged confidence in the financial system. Still, there were a few astute investors who were able to predict the blowup in mortgage-backed securities by analyzing the housing industry and the quality of loans, or lack thereof, at the height of the bubble. However, it is much harder to predict systemic risk when it comes from one, single source.

Ten years before the financial crisis, the saga of Long-Term Capital Management (LTCM) would serve as a dire preview. The $126 billion dollar hedge fund nearly collapsed in 1998 as a result of risky investments funded by excessive borrowing, and due to LTCM’s “too big to fail” stature, the Federal Reserve had to intervene and broker an arrangement for a group of banks to bail out the fund. Luckily, the Fed’s intervention helped to limit the domino effect that would have ensued had LTCM been allowed to fail.

In March of this year, a single investment firm again sparked chaos with risky investments funded by excessive borrowing. Archegos Capital Management, a multibillion-dollar family office, had built considerable leveraged positions in large media companies, such as ViacomCBS, before unpopular news came out that caused these stock prices to decline precipitously. The large losses suffered by Archegos triggered a margin call, which forces a borrower to inject more capital or sell borrowed securities. Eventually, the firm’s lenders seized the securities and began selling them en masse throwing the underlying companies’ share prices into further collapse. Despite regulators’ best efforts, potential systemic risk is ever present and can come seemingly out of nowhere.

Systemic risk often stems from the failure of risk management at an institutional level, but that does not mean that risk management cannot be used to effectively protect your portfolio from times of crisis. Portfolio and risk managers often employ a variety of hedging techniques and risk control actions that include position sizing, stress testing, running Monte Carlo simulations, and monitoring risk metrics on an ongoing basis. Additionally, managers that follow a strict process and have rules in place to limit irrational decision-making in times of deep market stress may have a better probability of controlling downside risk.


Disclaimer

The views expressed represent the opinion of Passage Global Capital Management, LLC. The views are subject to change and are not intended as a forecast or guarantee of future results. This material is for informational purposes only. It does not constitute as investment advice and is not intended as an endorsement of any specific investment. Employees and clients of Passage Global Capital Management may own securities discussed in this article. Stated information is derived from proprietary and nonproprietary sources that have not been independently verified for accuracy or completeness. While Passage Global Capital Management, LLC believes the information to be accurate and reliable, we do not claim or have responsibility for its completeness, accuracy, or reliability. Statements of future expectations, estimates, projections and other forward-looking statements are based on available information and Passage Global Capital Management, LLC’s views as of the time of these statements. Accordingly, such statements are inherently speculative as they are based on assumption that may involve known and unknown risks and uncertainties. Actual results, performance or events may differ materially from those expressed or implied in such statements.


Categories
Uncategorized

The Greater Fool Theory

“Men, it has been well said, think in herds; it will be seen that they go mad in herds, while they only recover their senses slowly, and one by one.”

– Charles MacKay

Extraordinary Popular Delusions and The Madness of Crowds (1841)


In the early morning hours of Friday, December 15, 1989, an Italian-American artist, Arturo Di Modica, with the help of a few friends dropped his latest work, the world-famous Charging Bull sculpture, outside of the New York Stock Exchange. The 7,100-pound, 11-foot-tall bronze sculpture was later re-erected on Broadway just north of Bowling Green in the Financial District of Manhattan, New York City.  Arturo Di Modica first conceived of the Charging Bull in the wake of the 1987 Black Monday stock market crash. His Charging Bull statue has become a physical manifestation of a ubiquitous Wall Street term, the bull market, and it has inspired veneration from tourists and investors hoping for a cut of the stock market riches it represents.

The current bull market, fueled by record low interest rates and friendly fiscal policies, continues to attract more, especially younger, investors. Homebound, internet savvy folks jump on the speculative bandwagon to try to make fast money without much regard to the business fundamentals of company shares and valuations. The proliferation of online trading platforms like Robinhood and commission free stocks and options trades offered by brokerage houses are also helping propel the huge momentum rally. Shares of dying retail chain GameStop rose a meteoric 1,625% in January, epitomizing a speculative mania not seen since the dot-com bubble in the late 1990s. There is a distinct difference between investing and speculation. However, day traders’ temptations to make quick profits and a sense of FOMO, or fear of missing out, are pushing them into new asset classes such as silver, which is another example of market madness and the herding behavior.

The problem with such speculative moves and chasing momentum stocks like GameStop and AMC Entertainment is that investors are betting that someone will buy the investment from them at a higher price. This is called the Greater Fool Theory. They are hoping that a greater fool will come along and take the shares off their hands. However, as experienced and professional investors know well, momentum fueled by the madness of crowds is a double-edged sword. It amplifies gains but can also magnify losses when the sentiment changes with almost no notice.

As Isaac Newton eloquently stated in the spring of 1720, “I can calculate the motions of the heavenly bodies, but not the madness of people.” When you are riding atop the charging bull and the bubble is burst, take care not to get bucked. If you are thrown from the reigns, beware the stampede.


The views expressed represent the opinion of Passage Global Capital Management, LLC. The views are subject to change and are not intended as a forecast or guarantee of future results. This material is for informational purposes only. It does not constitute as investment advice and is not intended as an endorsement of any specific investment. Stated information is derived from proprietary and nonproprietary sources that have not been independently verified for accuracy or completeness. While Passage Global Capital Management, LLC believes the information to be accurate and reliable, we do not claim or have responsibility for its completeness, accuracy, or reliability. Statements of future expectations, estimates, projections, and other forward-looking statements are based on available information and Passage Global Capital Management, LLC’s views as of the time of these statements. Accordingly, such statements are inherently speculative as they are based on assumption that may involve known and unknown risks and uncertainties. Actual results, performance or events may differ materially from those expressed or implied in such statements.
 

Categories
Uncategorized

Why Magnitude of Payoff is So Important

“If I’d tried for them dinky singles, I could’ve batted around six hundred.” – Babe Ruth

Babe Ruth is considered one of the greatest baseball players of all time. He hit 714 home runs, a league record at the time. Over his career, he collected 2,873 base hits. He was a seven-time World Series champion, and he made baseball’s “All Century” team. However, for many years, Babe Ruth was also known as the “King of Strikeouts.” He led the American League in strikeouts five times and accumulated 1,330 of them in his career. However, despite his large number of strikeouts, he was one of baseball’s greatest hitters, establishing many MLB batting records, including career home runs. Babe Ruth accepted his failures because he knew his successes would more than make up for them. His approach and mindset illustrate one of the most important concepts in portfolio management and investing: expected value or mathematical expectancy. Celebrated hedge fund tycoon George Soros, the man who broke the Bank of England after making a profit of $1 billion by shorting the British pound, once summed up the same concept by stating: “It’s not whether you’re right or wrong that’s important, but how much money you make when you’re right and how much you lose when you’re wrong.” This is also called the Babe Ruth effect. In other words, it is not the frequency of winning that matters but the frequency times the magnitude of the payoff.

However, many people are wired to avoid losses when making risky choices when the probability of different outcomes is unknown. In fact, investors are known to perceive losses on their investments as greater than they actually are. This is outlined in prospect theory, which was formulated in 1979 by Daniel Kahneman and Amos Tversky. Investors naturally prefer to be right more frequently than they are wrong. However, this mindset causes investors to overlook the key concept that the frequency of correctness does not matter as much as the magnitude of correctness.

The understanding of frequency versus magnitude, or in other words, the understanding of winning a few big payoffs while taking small, frequent losses, goes against investors’ intuitions. This investor bias of prioritizing correctness over payoff magnitude goes to show the importance of focusing on expected value when making investment decisions.

For example, take a look at this hypothetical portfolio below:

As you can see, even though the probability of the portfolio going up is less than the probability of the portfolio going down, the magnitude of portfolio return when the portfolio goes up offsets the higher probability of loss when the portfolio goes down. Therefore, the expected value, how much your portfolio is expected to gain or lose on average, is positive.

To sum it all up, investors do not necessarily need to be exactly like Babe Ruth or George Soros to have long-term success in these types of probabilistic exercises. However, it is essential that investors understand expected values, risk management, and perhaps, most importantly, themselves and their own emotional tendencies if they wish to achieve success with their investments. Keep in mind, just because something has a lower probability, it doesn’t mean that it’s not worth betting on.


The views expressed represent the opinion of Passage Global Capital Management, LLC. The views are subject to change and are not intended as a forecast or guarantee of future results. This material is for informational purposes only. It does not constitute as investment advice and is not intended as an endorsement of any specific investment. Stated information is derived from proprietary and nonproprietary sources that have not been independently verified for accuracy or completeness. While Passage Global Capital Management, LLC believes the information to be accurate and reliable, we do not claim or have responsibility for its completeness, accuracy, or reliability. Statements of future expectations, estimates, projections, and other forward-looking statements are based on available information and Passage Global Capital Management, LLC’s views as of the time of these statements. Accordingly, such statements are inherently speculative as they are based on assumption that may involve known and unknown risks and uncertainties. Actual results, performance or events may differ materially from those expressed or implied in such statements.
 

Categories
Uncategorized

What is Tail Risk?

Risk is a potential threat to every investment, no matter how large or small. It could be as simple as bad weather threatening an agricultural investment, or as complex as global geopolitics or a pandemic outbreak impacting the entire world and financial markets. For any investor, addressing risk and managing it appropriately is one of the keys to building towards a positive outcome. To do so requires knowing what risks you face.

What is Tail Risk?
Tail risk refers to an unlikely event. To get at the heart of the question, let’s go back to statistics 101 for a moment.
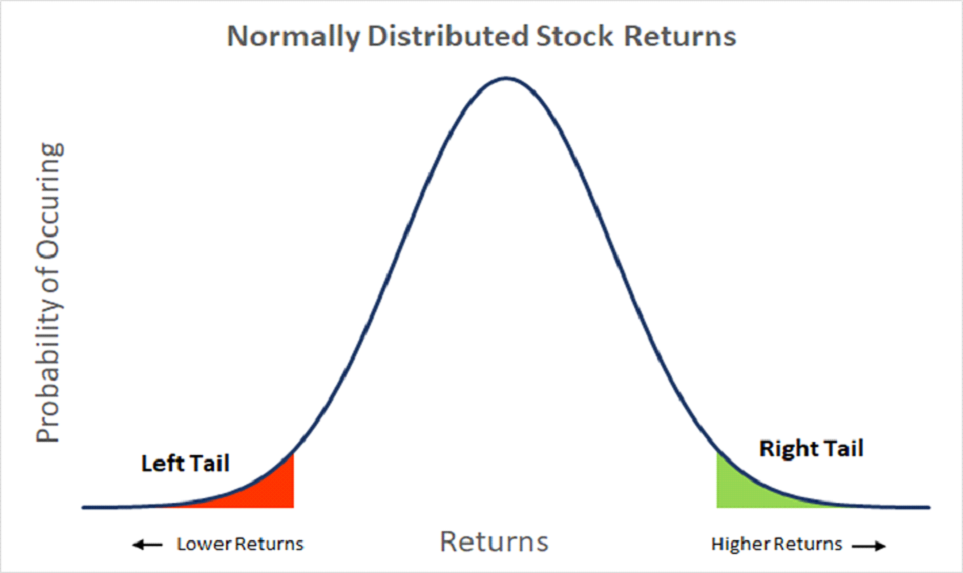
In a “normal distribution” that measures how close any given result is to the average expected result, there are “tails” at either end of the chart representing the most unlikely outcomes. In the financial world, one common definition considers the tails to be any result which is three or more standard deviations away from the average. For example, the right tail risk of a stock, or positive tail risk, would represent an upwards move much larger than average, accounting for the regular volatility of the stock. Of course, left tail risk is what concerns most investors.

Left tail risk is what we really mean when we talk about tail risk. Left tail events are significant downward moves that can not only harm investors’ portfolios but also their psychological makeup. Of course, the example above assumes that stock returns are normally distributed. In reality, empirical studies have shown that returns tend to be negatively skewed, meaning that left tail events are usually more impactful than right tail events. Perhaps this can best be understood with the old adage that markets go up like an escalator and down like an elevator. Tools such as Conditional Value at Risk (CVaR) exist to help account for this non-normality in measuring tail risk.

Commonly cited examples of tail risk events include the 2008 financial crisis and the COVID-19 pandemic, which we are experiencing now. These are extreme outlier events that negatively impacted many investments. Tail risk is one of the biggest potential threats to your portfolio, but it is also one of the hardest to manage — the only way to guard against it fully would be to see the future with a crystal ball.

So, Is Diversification the Solution?

In most investment strategies, diversifying the portfolio is often enough to mitigate a considerable amount of risk. By limiting your exposure to the threats faced by certain asset classes and spreading your money around, a sudden downturn in one area won’t sink your entire investment. In a tail risk scenario, however, when a large-scale event causes broader problems, diversification will not always be enough.

Just as a rising tide lifts all boats, a tsunami sinks them. In market tail risk scenarios, equity correlations tend to rise. In addition, other asset classes with historically low correlations to equities may not act as a good protector against these events (look no farther than the real estate market in 2008). If you do not adequately account for tail risk, these sudden and unpredictable events become much more difficult to weather. However, pulling your money out of the market is not a good long-term strategy, and a strategy that is too low-risk won’t generate appreciable returns. What’s the solution?

Active Risk Management

Active management of your investments and a dynamic approach to those assets can help you to build in some protections against tail risk events, which could include making changes as necessary in the allocation of funds and hedging your investments with the proper tools to better withstand a storm of financial turmoil.

The usage of machine learning algorithms and AI could revolutionize the way investors approach tail risk. Although these events might be outliers, planning for them by effectively and actively managing investments may help to limit their impact on your portfolio. Hedging against a market catastrophe might not be easy, but it is a necessity — and good insights make the difference.

The views expressed represent the opinion of Passage Global Capital Management, LLC. The views are subject to change and are not intended as a forecast or guarantee of future results. This material is for informational purposes only. It does not constitute as investment advice and is not intended as an endorsement of any specific investment. Stated information is derived from proprietary and nonproprietary sources that have not been independently verified for accuracy or completeness. While Passage Global Capital Management, LLC believes the information to be accurate and reliable, we do not claim or have responsibility for its completeness, accuracy, or reliability. Statements of future expectations, estimates, projections, and other forward-looking statements are based on available information and Passage Global Capital Management, LLC’s views as of the time of these statements. Accordingly, such statements are inherently speculative as they are based on assumption that may involve known and unknown risks and uncertainties. Actual results, performance or events may differ materially from those expressed or implied in such statements.