Categories
Uncategorized

Demystifying Position Sizing: A Dive into Probabilities, Payoffs, and Risk Management

Statistician and Black Swan author Nassim Taleb said “if you gave an investor the next day’s news 24 hours in advance, he would go bust in less than a year.” Taleb is implying that even with an informational advantage, investors must properly manage their risk. The feeling of having an edge, be it real or perceived, tends to lead investors to overconcentrate their bets. This type of behavior has been shown in behavioral experiments with simple mathematical solutions. In one study,[1]  participants were given a biased coin with a 60% chance of a flip landing on heads. They were given $25 and were able to bet any size and configuration for thirty minutes. They would also be able to pocket any winnings, subject to a cap of $250. Given the large probabilistic advantage, the researchers expected the participants to do reasonably well. As Nassim Taleb probably would have expected, the results were shockingly underwhelming with 28% of participants going bust and 67% betting on tails at least once. With no upper limit on the amount one could win, 300 flips with the optimal bet size could have yielded an astonishing value of over $3 million in this game. Why did so many participants fail to earn anything and what could they have done differently to convert their advantage into wealth?

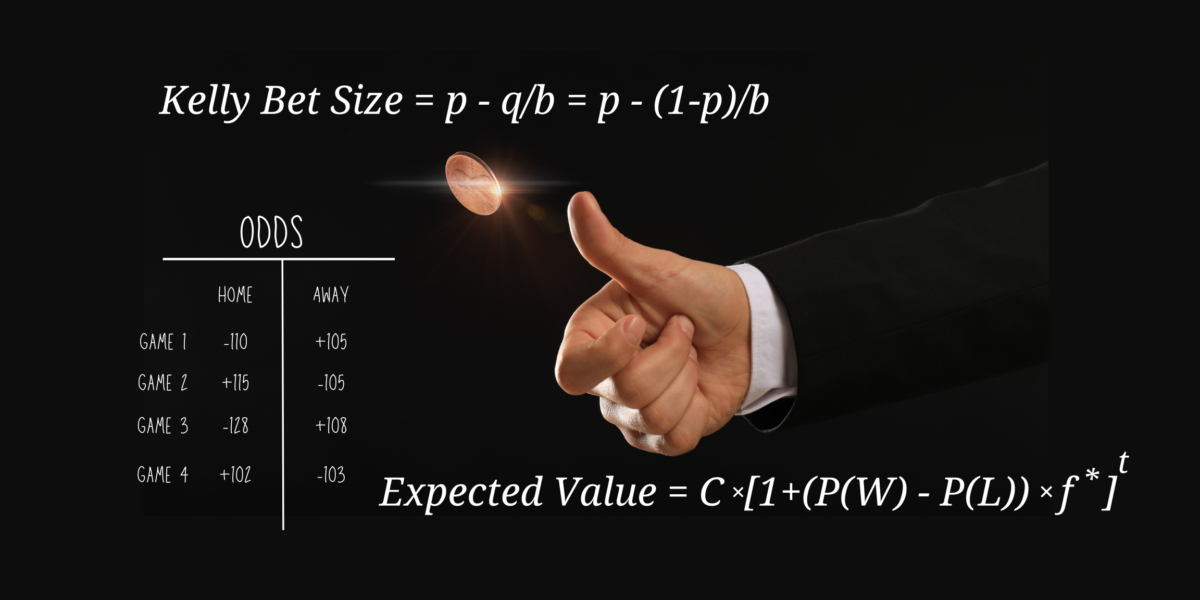
The aforementioned study is ultimately a challenge related to bet sizing. Mathematically, the optimal bet size for this problem is 20% of each participant’s “wealth.” This can be derived from the Kelly Criterion. The Kelly Criterion is a well-known formula for determining optimal bet size developed in 1956 by John L. Kelly, a scientist at AT&T Bell Laboratories. For a bet like a coin flip, where a negative outcome amounts to a total loss on the bet, the Kelly position size can be given by:


Kelly Bet Size = Probability of a Win – Probability of a Loss/ Fraction of Bet Gained with a Win


The expected value in this biased coin flip example is 0.6-0.4/1 = 0.2 on every dollar bet, or 20% of available wealth. The researchers point out that repeatedly betting a fixed 20% size gives a 95% chance of reaching the maximum payout of $250. Yet they found that participants frequently gambled everything on one bet and one third of participants ended with less money than they started with. This experiment shows that decisions around the allocation of funds are often sub-optimal. Heuristics like the Kelly Criterion can help investors to make rational decisions around position sizing and capital allocation.

The coin flip example is fairly straightforward: you have an advantage in knowing that heads is weighted to occur 60% of the time, and the payout will always match your bet, no matter which side you take. Thus, a rational player would always bet on heads, and with the correct position sizing, would have a fairly good chance to make substantial sums of money. Unfortunately, the real world is not so advantageous. Consider a pastime that has recently exploded in popularity due to regulatory changes: sports betting. Here, individual gamblers have no particular edge. In fact, they actually have a slight disadvantage since the sportsbook has to have their cut of the profits. To illustrate, we can examine the recent big football game between the Kansas City Chiefs and the San Francisco 49ers. Avid football fans already know the Chiefs won this game, but prior to the game, the odds had the 49ers favored at -128 and the Chiefs as underdogs at +108 according to CBS Sports. This strange notation simply relates to the profit received from a winning bet. To bet on the Niners and receive a $100 profit, bettors would need to wager $128. A $100 bet on the Chiefs would yield a profit of $108 in a Chiefs win. These payouts are based on probabilities which can be calculated as:


Implied Probability of a Win = Capital Risked/(Capital Risked + Potential Profit)


In this case, the implied probability of a 49ers win was 128/(128 + 100) = 56.14%. The probability of a Chiefs win was 100/(100 + 108) = 48.08%.[2] Using the Kelly Criterion with the market implied odds, the optimal bet size on the 49ers would be… 0%. Would a rational person bet on the 49ers then? The answer is: maybe. Suppose a person with superior football expertise who has performed deep analysis on the teams comes up with a 59% probability of the 49ers winning. With this increased win probability, our hypothetical gambler has an edge over the odds that the betting market is giving him. The Kelly Criterion now says that this gambler should bet 6.5% of his total capital on the 49ers. Of course, this presents two problems. First, our gambler could very well be wrong on his probability assumptions. That is, is he really smarter than the overall betting market? Second, as we now know, the Chiefs won. Despite a bet on the Niners being entirely rational, assuming our gambler’s probability estimates are correct, we are still dealing with probabilities. There is still a 41% chance that the bet will lose. This is why position sizing is so important. By only risking 6.5% percent of capital, our gambler can survive to keep making more bets and have a chance to gradually compound his winnings.

With this backdrop, there are several takeaways from these examples that can be applied to investing in financial markets. The first is that investing is a zero-sum game, much more closely represented by the sports betting scenario than the coin flip example. When an investor purchases an asset, there is always another party across the table selling the asset, similar to betting on the other team. Like sports betting, the asset will be priced according to market expectations. A rapidly growing company with solid underlying fundamentals will very likely trade at a higher valuation compared to a distressed company on the verge of bankruptcy. In financial theory, a higher valuation implies a lower expected return in the future. Conversely, a lower valuation would portend a higher expected future return. Of course, those return expectations come with extreme differences in risk. Investors are compensated, or given a premium, for taking on risk. What sort of payoff would you require to bet on the local high school junior varsity football team versus the 1985 Chicago Bears?[3]

A second takeaway is that the ability of investors to consistently outperform the markets ultimately depends on their ability to examine outcomes not in terms of certainties but in terms of probabilities, and investors must be able to convert those probabilities into rational position sizes given that financial markets contain high levels of uncertainty. Even the sports betting example above is ultimately too simplistic as it focuses on a single estimate of probability. Investors must instead recognize that outcomes are not binary; there are numerous scenarios which could play out, each with their own likelihood of being realized. When you add this uncertainty, the optimal bet size likely becomes smaller and begins to level off for larger bet sizes.

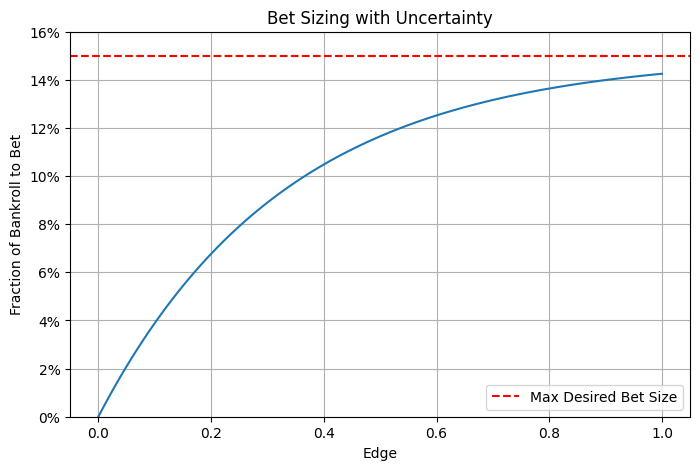
A hypothetical example with non-linear bet sizing. As the bet size becomes larger, the increase in bet size becomes smaller. In this case, the individual does not wish to bet more than 15% of capital on one bet, no matter the advantage they have (or think they have).


The final key takeaway is that investors must be aware of potential biases which could affect their decision-making. For example, in the example of the hypothetical gambler who believes his estimates are more accurate than the odds given by sportsbooks, one must ask if the gambler actually has an edge or if he is overconfident in his abilities. There is a reason the famed psychologist and Nobel Prize winner Daniel Kahneman called overconfidence “the most significant of the cognitive biases.” Similarly, it is challenging to beat the stock market consistently. Having a rigorous investment process in place can help to instill discipline and avoid overconcentrating in  too few positions.

An additional bias that could impact position sizing is loss aversion. The Kelly Criterion, for example, will give a rational position size for risk-neutral investors, but in reality, most investors are risk averse. This means losses have a larger psychological impact than gains. Suppose the Kelly Criterion indicates optimal position sizing of 20% of wealth. Someone starting with $100 may be very willing to risk $20, but an investor with $500,000 may not be willing to risk a daunting $100,000 on a single trade.  For this reason, it is common to see traders use a fraction of the optimal Kelly bet size to make the volatility more tolerable.

Ultimately, investors must consider expectations of both risk and return before translating investment opportunities into potential positions. Furthermore, systematically applying a heuristic such as the Kelly Criterion can help to determine appropriate position sizes, but the overall portfolio must also be a consideration. By just applying the Kelly Criterion to individual positions, the portfolio may be taking on much more risk than intended if the positions are highly correlated. Position sizing is a key driver of portfolio returns, and it is essential to ensure positions are sized not only to take full advantage of solid opportunities when they arise but also to ensure portfolio survival in the long run.


[1] Haghani, Victor and Dewey, Richard, Rational Decision-Making under Uncertainty: Observed Betting Patterns on a Biased Coin (October 19, 2016).

[2] Note that the sum of the alternative win probabilities exceeds 100% since the bets are priced to make money for the sportsbook, no matter who wins.

[3] The ’85 Bears are widely regarded as one of the best NFL teams of all time, scoring 456 points while only allowing 198 according to ESPN.


The views expressed represent the opinion of Passage Global Capital Management, LLC. The views are subject to change and are not intended as a forecast or guarantee of future results. This material is for informational purposes only. It does not constitute investment advice and is not intended as an endorsement of any specific investment. Stated information is derived from proprietary and nonproprietary sources that have not been independently verified for accuracy or completeness. While Passage Global Capital Management, LLC believes the information to be accurate and reliable, we do not claim or have responsibility for its completeness, accuracy, or reliability. Statements of future expectations, estimates, projections, and other forward-looking statements are based on available information and Passage Global Capital Management, LLC’s views as of the time of these statements. Accordingly, such statements are inherently speculative as they are based on assumptions that may involve known and unknown risks and uncertainties. Actual results, performance or events may differ materially from those expressed or implied in such statements.

Categories
Uncategorized

A Journey into Generative AI: Unleashing the Power of Creative Machines

The year 2023 witnessed a surge in discussions around artificial intelligence, fueled by OpenAI’s groundbreaking release of ChatGPT in November 2022. The ensuing excitement reverberated through the stock market, with tech giants like Apple, Microsoft, Google, Amazon, Meta, Tesla, and Nvidia, collectively known as the Magnificent Seven, leading the charge. Nvidia, in particular, dazzled investors with an astonishing 239% return in 2023, exemplifying the burgeoning influence of AI in shaping market dynamics. At the heart of this transformative wave lies generative AI, a special subset poised to redefine the technological landscape.

Generative AI, encapsulated by platforms such as ChatGPT, possesses the unique ability to create diverse forms of data, including text, images, audio, and video. A non-generative model may be well-suited for a task such as facial recognition where, in contrast, generative AI could be used to produce an image of a face solely based on a textual description. It operates by discerning patterns within a dataset and leveraging this knowledge to generate entirely new, yet similar, data with comparable attributes.

The ascent of generative AI gained momentum in 2014, marked by the introduction of Generative Adversarial Networks (GANs) by Ian Goodfellow. GANs, incorporating neural networks, play a pivotal role in tasks such as image generation. More recently, the advent of transformers, as exemplified by the “GPT” in ChatGPT (Generative Pre-trained Transformer), has redefined the landscape of generative AI models. Transformers utilize attention mechanisms, a mathematical approach to identifying data connections, enabling them to filter out irrelevant information and enhance overall efficiency.

The implications of transformer models are profound, ushering in a semi-supervised learning paradigm. This eliminates the need for extensive human labeling of training data, making tasks like image classification more scalable and accessible. Large-language models (LLMs), a subset of generative AI utilizing the transformer architecture, have emerged, featuring prominently in tools like ChatGPT, Microsoft’s Bing Chat, and Google’s Bard. These platforms enable users to input text prompts and receive contextually relevant responses, showcasing the vast potential of generative AI in diverse applications such as content generation, computer programming assistance, summarization of broader texts or topics, language translation, etc. Users can even mimic the style of prominent authors. To showcase the power of this technology, we asked ChatGPT to write a research report on Apple stock in the style of William Shakespeare. Below is an excerpt from the beginning of this masterpiece:


A Bard’s Ode to the Apple Inc. (AAPL) Stock: A Theatrical Rendition

                To buy or not to buy, that is the question –

                Whether ‘tis nobler in the portfolio to suffer

                The slings and arrows of outrageous market volatility,

                Or to take arms against a sea of financial troubles

                And, by opposing, end them.


This re-characterization of Hamlet’s eminent soliloquy goes on for eight more stanzas, although it may require an English teacher to discern whether it contains a buy or sell recommendation for Apple.

An image of William Shakespeare on Wall Street produced using generative AI within the graphic design tool Canva. A closer inspection of the fine details displays the current shortcomings of generative AI technology.


Of course, it is essential to approach generative AI with caution, acknowledging that while LLMs can provide relevant responses, accuracy is not guaranteed. The potential for misinformation requires users to diligently fact-check outputs, especially when dealing with critical domains like legal research. A law firm made headlines last year when it used ChatGPT for assistance in putting together a legal brief which was filed with the court. ChatGPT was able to identify several court cases with relevant precedent which were included in the brief. Yet, there was a complication: some of the cases being cited as precedent did not exist; they were created by ChatGPT.

In the investment industry, generative AI may assist in tasks such as research summaries, sentiment analysis, identifying key points of management calls, and summarizing analyst opinions. On a more technical level, quantitative researchers can employ generative models to supplement observed data, thereby increasing the volume of data used in training specialized machine learning models. Ultimately, generative AI is not a substitute for robust investment management. Generative AI’s true value lies in augmenting human decision-making rather than supplanting it.

In conclusion, generative AI represents a pivotal force in technological advancement, offering a tantalizing glimpse into a future where human-machine collaboration reaches unprecedented heights. From content creation to problem-solving, the capabilities of generative AI pave the way for innovation across diverse industries. As we navigate this exciting frontier, it is imperative to strike a balance between embracing the potential and responsibly harnessing the power of generative AI.

Author’s Note: For those wondering, yes, ChatGPT was used in the production of this article. The first draft was written by the inferior human hand, and this was given to ChatGPT with the prompt: “Take the following blog article and improve the writing style.” Some additional changes were made for the final version.


The views expressed represent the opinion of Passage Global Capital Management, LLC. The views are subject to change and are not intended as a forecast or guarantee of future results. This material is for informational purposes only. It does not constitute investment advice and is not intended as an endorsement of any specific investment. Stated information is derived from proprietary and nonproprietary sources that have not been independently verified for accuracy or completeness. While Passage Global Capital Management, LLC believes the information to be accurate and reliable, we do not claim or have responsibility for its completeness, accuracy, or reliability. Statements of future expectations, estimates, projections, and other forward-looking statements are based on available information and Passage Global Capital Management, LLC’s views as of the time of these statements. Accordingly, such statements are inherently speculative as they are based on assumptions that may involve known and unknown risks and uncertainties. Actual results, performance or events may differ materially from those expressed or implied in such statements.


Categories
Uncategorized

Fed’s Rate-Effect Lag Conundrum

When the Fed ended its two-day November policy meeting, it raised the target federal funds rate by three-quarters of a point for a fourth straight time. Its key rate now stands in a range of 3.75% to 4%, the highest in 15 years. It was the central bank’s sixth rate hike since January of this year, which is the fastest pace in decades as it continues its fight to beat back elevated and persistent inflation by slowing economic growth. Investors hoping for the Fed to signal a more dovish tone were disappointed by Federal Reserve Chairman Jerome Powell’s message that rates would stay higher for longer to battle inflation. The year-over-year inflation is currently more than 8%, far above the Fed’s 2% target with few signs yet of cooling off. Core CPI, which strips out the volatile food and energy components accelerated 0.6% in September and was up 6.6% from a year ago, which was the highest pace since August 1982.

However, these rate hikes work with “long and variable lags.” The phrase was coined by famous Nobel-prizewinning American economist Milton Friedman to explain the delayed and uncertain effects of monetary policy in the economy. Raising rates should cause growth to slow down and in turn should lead to lower inflation. However, it can take time for the full impact to be felt; hence Friedman’s idea of a long lag. The variability, meanwhile, refers to the lack of a predictable interval between rate hikes and their  results. As a matter of fact, The International Monetary Fund said last month that interest rate changes have their peak effect on economic growth in about one year and on inflation in three to four years. In the U.K., a 1 percentage-point increase in the policy rate reduces output by 0.6% and inflation by up to 1 percentage point after two to three years, according to a 2016 paper by James Cloyne, then of the Bank of England, and Patrick Hürtgen of Germany’s Bundesbank.

This means that the effects of the global expansionary monetary policies implemented in response to the Covid-19 pandemic induced recession are still being felt. These policies were designed to increase the supply of money and credit to generate economic growth. Meanwhile, the recent consecutive rate hikes have barely cooled either inflation or the labor market at this point.

However, investors and economists are expecting the Federal Reserve’s aggressive interest rate increases to eventually curtail inflation. A widely followed measure of investors’ annual inflation expectations over the next five years, the five-year break-even inflation rate, stood at 2.61% in early November. It reached a record high of 3.59% in March of 2022, and since then it has been coming down gradually, implying investors expect inflation to decline significantly over the next five years. The record low was -2.24% in November of 2008.

Another economic metric indicates an impending economic slump and a looming recession. In recent months, a measure of the money supply called M2 that includes cash, checking deposits, and easily-convertible near money has been falling. In September, the M2 growth rate was 2.56 percent. That’s down from August’s growth rate of 3.82 percent. September’s rate was also well down from September 2021’s rate of 12.87 percent. Recessions tend to be preceded by decelerating money supply. However, the money supply growth rate has a tendency to subsequently start ticking up again before the onset of recession.

It is no surprise that key yield-curve indicators favored by Wall Street have also started to signal that the United States is heading towards an economic slump – perhaps within a year.  In October, 10-year Treasury yields fell below 3-month Treasury yields, creating a so-called yield curve inversion. This signals that investors desire more compensation for buying short-term bonds as compared to longer-term bonds in response to the Fed’s rate hikes and slower anticipated growth. An inversion occurred earlier this year between 10-year and 2-year Treasuries, and in early November, the spread between these yields touched a level not seen since the early 1980s.

The Fed is well aware of the rate-effect lag, and this could create the risk that the Fed might ease off too soon. This is especially true if the hot job market starts to cool and people begin losing their jobs. Recent announcements of some technology companies cutting their workforce, including Twitter and Meta’s upcoming large-scale layoffs, could spill over to other industries. This could prompt a reaction from the Fed to stop increasing rates too early while prices are still rising. Investors may then conclude the Fed isn’t committed to fighting inflation. This would hurt their credibility, especially when they were too slow to begin raising interest rates in the first place.

But lags carry the opposite problem, too. The Fed could instead keep increasing and holding interest rates too high for too long to preserve their credibility, especially if upcoming inflation data continues to run hot as we’ve seen recently, risking potentially a deeper recession than is necessary.

This rate-effect lag is the conundrum facing the Federal Reserve today and let’s hope  the Fed can still achieve a so-called “soft-landing.” Policy mistakes from the Fed in the United States may have more profound ripple effects for the global economy. If you are a student of world affairs, you may know the phrase “when America sneezes, the world catches a cold.” Let’s hope that no one gets a cold before we head into the winter months.


The views expressed represent the opinion of Passage Global Capital Management, LLC. The views are subject to change and are not intended as a forecast or guarantee of future results. This material is for informational purposes only. It does not constitute investment advice and is not intended as an endorsement of any specific investment. Stated information is derived from proprietary and nonproprietary sources that have not been independently verified for accuracy or completeness. While Passage Global Capital Management, LLC believes the information to be accurate and reliable, we do not claim or have responsibility for its completeness, accuracy, or reliability. Statements of future expectations, estimates, projections, and other forward-looking statements are based on available information and Passage Global Capital Management, LLC’s views as of the time of these statements. Accordingly, such statements are inherently speculative as they are based on assumptions that may involve known and unknown risks and uncertainties. Actual results, performance or events may differ materially from those expressed or implied in such statements.

Categories
Uncategorized

The Recession Question

The United States entered into a technical recession with the second quarter showing negative growth in real GDP for two consecutive quarters. However, the word “technical” is key. Official recessions are declared by the National Bureau of Economic Research (NBER), which takes a more nuanced perspective. The NBER defines a recession as involving “a significant decline in economic activity that is spread across the economy and lasts more than a few months.” The NBER declares recessions retroactively, meaning that they wait for the data to support their conclusions and then determine whether the U.S. has been in a recession. Economic growth is only one component of a recession; the other major factor is much more relevant and visible to most people: the unemployment rate. Fortunately, unemployment is still low and provides no hint that the U.S. is currently in a recession. This, of course, does not say anything about the future direction of the economy. Unemployment is a lagging indicator (that is, it provides an indication of the previous economic state rather than a prediction of the future state). However, robust employment does indicate that the economy is still relatively healthy despite weak consumer sentiment and strong inflationary pressures.


Although many employers are having trouble finding workers, it is debatable whether the U.S. is in a wage-price spiral. This occurs when rising consumption costs spur workers to demand higher wages resulting in a stagflationary feedback loop. There is no doubt that both inflation and nominal wages are rising, but they are not rising at the same rate. While average hourly wages grew by 5.2% year-over-year in July on a nominal basis, real average hourly wages declined by 3% according to data from the Bureau of Labor Statistics.


This does not imply that a tight labor market and rising wages are irrelevant to inflation, but it does imply that there are other drivers making a greater impact on inflation; primarily supply-chain struggles and energy prices. In July, energy expenditures made up about 9% of CPI, with energy prices rising 32.9% from a year prior. The good news is that energy prices have started to decline over the short-term. Gasoline prices, for example, declined 7.7% from June to July. This led to a welcome slowdown in inflation with prices up in July only 8.5% year-over-year as compared to 9.1% for June. It will take more than one month to reign-in inflation, however, especially as core CPI, which excludes volatile food and energy costs, barely budged in July compared to a month prior (albeit after declining more quickly from March to June than the all items CPI). The Fed will likely have to continue being aggressive in order to maintain credibility in its ability and willingness to fight inflation.

The tight labor market gives the Fed some room to maneuver and still maintain the hope of a soft landing, at least for now. Focusing all attention on the labor market would indicate that the U.S. is not even close to a recession at the moment. One relevant indicator to examine is the Sahm Rule, created by economist Claudia Sahm, which signals a recession as soon as the three-month moving average of the unemployment rate rises by 0.5% relative to its 12-month low. This is meant to be a real-time signal of recession rather than a retroactive declaration, as with the NBER. As one would expect, this is currently well below the 0.5% threshold that would signal recession.


As previously mentioned, unemployment is a lagging indicator, and does not give a strong signal about the future health of the economy. To try to predict future economic conditions, one may do better to focus on leading indicators. One of the best leading indicators is the stock market. This is unfortunate for investors who may try to use recessions as a trading signal. Often by the time the economy is in a recession, much of the damage in stocks has already been done. The S&P 500 Index entered bear market territory earlier this year but has recovered some of the loss. Whether the market is in a true recovery or “bear market rally” remains to be seen, but the heightened volatility does suggest that some investors are wary of an economic downturn. Further evidence of recession fears comes from the U.S. Treasury yield curve. This classic recession indicator is said to forebode recession when it is inverted, or long-term Treasury yields fall below short-term yields as investors price in the anticipation of rate hikes from the Fed (short-term rates are more sensitive to changes in the Federal Funds Rate than long-term rates are[1]). The yield curve is in the process of flattening and has already inverted when comparing the long-term 10-year yield vs. the short-term 2-year yield. Some argue that a better indicator is the spread between the 10-year and 3-month yield, which has not yet inverted, but has been on the verge of inversion since late July. There are other leading indicators as well, which are often combined together into a single index to provide a better signal; but, of course, none of these indicators are perfect predictors.


There is still work to do before the Fed turns dovish again, and investors should not expect a technical recession by way of declining GDP growth to turn the Fed’s attention away from inflation. Many blame the Fed, at least partially, for high inflation due to the vast amount of monetary stimulus injected into the economy in response to the covid-19 pandemic. During the pandemic, the Fed made clear that their priority was very understandably lowering unemployment. As the pandemic dragged on into 2021 and unemployment began to fall while inflation started to creep up, the Fed still was focused on unemployment while dismissing inflation as transitory. Then, inflation started to dominate the headlines and the Fed switched gears into inflation-fighting mode. The Fed has been somewhat fortunate in that it has been able to focus most of its energies at one time on either unemployment or inflation; not both. Although the Fed must bring inflation down, Jerome Powell and company must be careful not to lose total sight of the labor market. As rates continue to rise, the Fed’s already difficult task could become more difficult. The Fed will have to walk a tightrope: a wrong step in one direction and inflation will continue to entrench itself in the economy; a wrong step in the other, and workers could begin to lose jobs at a higher rate. If the latter happens, the U.S. could experience a real recession. But that has not happened yet, and there is still a possibility that the Fed can walk the tightrope to the other side without stumbling.


[1] Note that this refers specifically to yields rather than prices. Bond prices are more sensitive to interest rate changes at the long end of the curve.


The views expressed represent the opinion of Passage Global Capital Management, LLC. The views are subject to change and are not intended as a forecast or guarantee of future results. This material is for informational purposes only. It does not constitute as investment advice and is not intended as an endorsement of any specific investment. Stated information is derived from proprietary and nonproprietary sources that have not been independently verified for accuracy or completeness. While Passage Global Capital Management, LLC believes the information to be accurate and reliable, we do not claim or have responsibility for its completeness, accuracy, or reliability. Statements of future expectations, estimates, projections, and other forward-looking statements are based on available information and Passage Global Capital Management, LLC’s views as of the time of these statements. Accordingly, such statements are inherently speculative as they are based on assumption that may involve known and unknown risks and uncertainties. Actual results, performance or events may differ materially from those expressed or implied in such statements.

Categories
Uncategorized

The Winter of Crypto’s Discontent

The rise and fall of crypto assets over the preceding two years adds another chapter to the nascent narrative of the crypto industry. Many investors now believe that crypto markets are in the midst of a ‘crypto winter,’ a term used to describe long periods of underwhelming performance. The boom-and-bust nature of crypto assets is not exclusive to the current period, but there are several unique aspects of the recent decline including crypto’s shifting relationship to macro-factors and the specific market dynamics that influenced price action in the latest cycle.

Impact of the Grayscale Bitcoin Trust:

With the launch of Grayscale’s Bitcoin Trust (“GBTC”) in 2015, there was an easy way for investors to gain bitcoin exposure with regulatory compliance. Demand for public market vehicles afforded GBTC a significant premium to the Net Asset Value (“NAV”) of the underlying bitcoin (“BTC”) holdings in the latter part of 2020. To capture this premium, institutions subscribed to the trust by depositing bitcoin with the intention of selling GBTC after the six-month lockup. This crowded NAV-arbitrage trade was a source of buying pressure for BTC up until mid-2021. When the lockups ended and institutions took profit on the trade, the premium fell fast. Competition from a new bitcoin ETF in Canada also contributed to the collapse of the GBTC premium. Since GBTC has no near-term mechanism for shareholders to redeem its bitcoin holdings, nothing prevented GBTC from sliding to a significant discount to NAV. The biggest hope for those seeking to cash out at NAV was Grayscale’s push to convert the trust to an ETF. However, the SEC shut down their bid, sending the discount even lower (28.7% as of writing).

The GBTC phenomenon contributed to Bitcoin’s upward and subsequent downward price movement in the latest cycle, creating fragility among some crypto institutions who leveraged the arbitrage trade (perhaps underestimating the potential for a steep discount). Then the TerraUSD stablecoin collapsed.

Terra/ LUNA Breakdown

TerraUSD (“UST”) was an algorithmic stablecoin that maintained a U.S. dollar peg by being redeemable for $1 worth of the ecosystem token LUNA. This simply means that each UST token was supposed to be priced at 1 U.S. dollar at all times (or very close to it). If the UST price fell below $1, arbitrageurs could purchase UST at the lower price and trade it for $1 worth of LUNA, therefore profiting from the spread. Similarly, when UST traded above $1, arbitrageurs could exchange LUNA for UST. This mechanism kept the UST price very close to $1 for a while, but it only worked so long as investors believed it would work.

Algorithmic stablecoins have a long history of failed experiments with break downs in their economic assumptions. However, subsequent designs attempt to improve upon the shortcomings of previous iterations. Some thought Terra had solved the puzzle as LUNA quickly grew to a market capitalization of over $30 billion (a top-10 cryptocurrency by market capitalization). Still, others noticed red-flags and vulnerabilities.

The primary demand for UST was driven by Anchor, a decentralized lending platform which offered a whopping 19.5% annual return for depositing UST. In fact, of the $18 billion total supply of UST, $16 billion was deposited in Anchor— the first strong indicator that the system was fragile. Where was this yield coming from? Borrowers only paid around 10% APR on their loans, and they were scarce compared to depositors. Anchor’s cash inflow at the end of April was about $0.7 billion while its cash outflow for UST deposits was about $2.6 billion. Some more yield was sourced from transaction fees. Still, most of the difference had to be supplied by depleting Terra’s reserve funds. In other words, the yield was not sustainable without net inflows.

A 20% annual return for simply holding a US-dollars-equivalent would in principle attract any investor. It therefore isn’t surprising that this return proved to have associated risk. Yield in crypto usually comes from four sources: pooling tokens together to provide the market with liquidity, lending and borrowing, staking, or temporary reserves (as was the case with Terra). With DeFi, anyone can easily (and perhaps unwittingly) gain exposure to complex instruments and market activities such as arbitrage, market-making, and lending. Traditionally these activities are reserved for sophisticated firms within a regulatory framework[1] (and even they can collapse when risk is not managed properly). While everything crypto carries significant risks at this stage, carefully examining the points-of-failure and being aware of the pitfalls of prior DeFi experiments can help evaluate the trade-offs and determine if capturing the risk-premia is worthwhile for a given tolerance.

An apt comparison to the TerraUSD de-pegging is what happened to supposedly safe money market mutual funds in 2008 when the Reserve Primary Fund broke its dollar peg. It became unable to meet redemption requests due to exposure to Lehman Brothers’ short-term loans as worried investors rushed to pull from the fund. Theoretically, this sort of risk is mitigated, because, as a decentralized platform, the cash flows of Anchor are executed automatically. The near-instant arbitrage capability of the cryptocurrency should also provide some stability. However, crypto-specific dynamics also created more risks. In practice, perfect arbitrage was limited by a percentage fee when redeeming LUNA for UST. This was typically set at 2 percent, but it was designed to increase exponentially when traders redeemed more LUNA than a set redemption capacity. The purpose of this mechanism was to encourage trading LUNA on secondary markets so there would be greater external liquidity. However, semi-reliance on these markets to round-out the arbitrage meant a reliance on their liquidity.

Liquidity fragmentation and opportunistic traders

In crypto, liquidity is fragmented across many centralized exchanges, networks, and decentralized automated market makers (“AMMs”). This enables relatively small capital to greatly influence price in certain situations. The liquidity is also publicly visible—everyone can see when it’s lacking. At the exact moment when the Terra team temporarily withdrew a significant amount of liquidity on Curve (the largest stablecoin AMM) to reallocate it to a new pool, a trader sold 85 million UST on the Curve pool. Along with 6 large wallets which followed (either selling UST or removing liquidity from the pool), this catalyst was enough to briefly break the peg. On-chain data suggests the trades were pre-planned, as huge amounts of UST were transferred from Terra to Ethereum compared to the daily average prior to the event; an increase led entirely by 10 large wallets.

Another 200 million UST was spontaneously sold on the Binance exchange. The dollar peg was only slightly broken at this point, but this sparked fear and uncertainty— UST was rapidly pulled from Anchor (9 billion of 14 billion was withdrawn in 48 hours) and LUNA’s price fell over 50%. If the LUNA market-cap fell below UST, UST could not hope to be redeemed for fair value. In an attempt to prevent this total-collapse threshold from being reached, the Terra organization sold over 80,000 reserve BTC, which contributed to a broader crypto-meltdown — but it wasn’t enough. To compound the issue, a free-fall LUNA price made it possible for malicious actors to abuse the proof-of-stake consensus mechanism and manipulate transactions as good-faith validators represented less capital in dollar terms (or fled the falling token). Therefore, Terra was forced to halt the chain entirely.

The contagion of the collapse led to a cascade of liquidations and margin calls that dried-up liquidity and made some firms insolvent— and segued into another de-peg that made matters even worse.

Staked Ethereum and GBTC Déjà vu

Lido’s stETH is a popular derivative of Ethereum (“ETH”), and the two historically maintained a 1:1 price ratio. With Terra’s collapse, insolvency and capital constraints depleted the available stETH liquidity. Meanwhile as people fled Terra’s ecosystem, large quantities of stETH that were deposited in Anchor were bridged back to the Ethereum network in a matter of days. Amidst general uncertainty and loss of Anchor’s yield incentive, selling pressure mounted on stETH (in excess of ordinary ETH). Because stETH cannot yet be directly redeemed for ETH, there was no arbitrage to defend the peg.

As stETH fell relative to ETH, leveraged traders who assumed stETH would remain roughly 1:1 with ETH were forced to liquidate their positions (creating a flywheel of sell-pressure).

This interconnected chain of events has exposed the overleveraged risk-taking of many of the largest centralized cryptocurrency institutions who now face insolvency (reminiscent of Lehman-brothers). And their retail customers may never get their funds back. In contrast, the blue-chip decentralized protocols like Aave, Compound, MakerDAO, and Uniswap have maintained flawless 24/7 functionality irrespective of market conditions— a testament to the reliability of the automated infrastructure.

The fact that much of the sell-pressure has been related to excess leverage could actually provide comfort to crypto bulls. Fundamental innovation and network effects remain intact, so perhaps the true demand is temporarily underrepresented in price. However, macro-concerns remain.

Crypto’s Shifting Relationship to Macro Factors

According to Shapeshift[2] founder Eric Voorhees, “this is the first crypto crash which is clearly… a result of macro factors.” However, the crypto-specific events described above certainly fueled the fire. According to the long running crypto hedge fund Pantera Capital— fundamentally “there really isn’t a reason that Bitcoin needs to be a risk asset correlated thing.” Recently, Bitcoin has performed more like a high-beta stock than ever before— a far cry from digital gold.

Note the uptick in the R-squared[3] of Bitcoin and the Nasdaq 100 Index (QQQ):

Historically, bitcoin’s correlation with stocks is elevated during major S&P 500 downturns. However, this time the relationship is much stronger and has persisted for longer than usual.

Key factors contribute to making this period unique (from the downturns of 2014, 2018, and 2020):

  • The type of investor is different – According to Mike Boroughs, founder of the blockchain investment fund Fortis Digital: “Now you’ve got guys who are across the whole span of risk assets. So when they’re getting hit over there, it’s impacting their psychology.” This extends to the uptick in institutional players whose other exposures and responsibilities can influence their allocation.
  • Federal reserve policy – The viewpoint of Bitcoin as a sponge for excess liquidity has been vindicated thus far. Many anticipate that a tighter monetary environment could be here for a while. To what extent is the thus-far stellar performance of bitcoin dependent on an accommodative monetary policy? There is little historical precedent for guidance.

If federal reserve policy induces a period of lower growth for traditional assets, it could be an opportunity for crypto to prove its value as a counter-cyclical forward-looking investment opportunity. Or are the current correlations more of a lasting trend?

[1] See our previous blog post “Developments in the US Regulatory Environment for Cryptocurrencies”

[2] ShapeShift is a non-custodial cryptocurrency exchange founded in 2014 that open sourced all code and fully dissolved its corporate structure in 2021, transitioning to a decentralized community-owned and governed platform.

[3] Rsquared is a statistical measure that, in this case, represents the proportion of the variance of BTC’s returns that is explained by QQQ returns. The value can range from 0 to 1 with higher values indicating a stronger relationship.


The views expressed represent the opinion of Passage Global Capital Management, LLC. The views are subject to change and are not intended as a forecast or guarantee of future results. This material is for informational purposes only. It does not constitute as investment advice and is not intended as an endorsement of any specific investment. Stated information is derived from proprietary and nonproprietary sources that have not been independently verified for accuracy or completeness. While Passage Global Capital Management, LLC believes the information to be accurate and reliable, we do not claim or have responsibility for its completeness, accuracy, or reliability. Statements of future expectations, estimates, projections, and other forward-looking statements are based on available information and Passage Global Capital Management, LLC’s views as of the time of these statements. Accordingly, such statements are inherently speculative as they are based on assumption that may involve known and unknown risks and uncertainties. Actual results, performance or events may differ materially from those expressed or implied in such statements.


Categories
Uncategorized

Developments in the US Regulatory Environment for Cryptocurrencies

Regulation is coming to digital assets after a flurry of catalysts, including:

  • The total collapse of the UST algorithmic stablecoin and associated token Luna (which had a market cap of over $40 billion; among the top 10 cryptocurrencies by market cap).
  • Very visible influencers marketing what many argue amount to scams.
  • Abuse of informational advantages (or insider trading) at exchanges. For instance, the DOJ is currently bringing its first NFT insider trading case against a former OpenSea employee.[1]
  • The general explosion in cryptocurrency interest and related applications in the last few years; and the accompanying ~$40B lost in exploits.
  • And the overall market downturn.

On March 9, President Joe Biden issued the “Executive Order on Ensuring Responsible Development of Digital Assets.” The executive order named the following areas of focus:

  • Consumer and investor protection
  • Financial stability and systemic risk
  • The prevention of illicit finance
  • U.S. leadership and competitiveness
  • Financial inclusion
  • Responsible innovation

And spurs action from the following regulatory bodies:

  • the Securities Exchange Commission (SEC)
  • Commodity Futures Trading Commission (CFTC)
  • the Treasury Department (OFAC)
  • Financial Stability Oversight Council (FSOC)
  • Commerce Department
  • and the Federal Reserve

Each of these parties treats cryptocurrencies differently, and their overlapping regulatory authority has been an ongoing conflict.


Securities or Commodities?

SEC chair Gary Gensler has repeatedly sought to bring digital assets under the SEC’s jurisdiction as securities; sometimes clashing with the CFTC (who seek to classify cryptocurrencies as commodities). In a recent interview, Gensler separated Bitcoin as the only cryptocurrency he was prepared to publicly label a commodity, although his statement still leaves the door open for others. “Crypto financial assets have the key attributes of a security,” Gensler said recently, noting that there is almost always a centralized entity that directs projects and stands to profit the most.

When Ethereum first launched in 2014, the Ethereum Foundation held this type of centralized role. However, by 2018, Ethereum had reached “sufficient decentralization” according to then-SEC Director for the Division of Corporation Finance William Hinman, and therefore ought to be classified as a commodity. It’s possible that Gensler was hesitant to confirm this classification for Ethereum because it may hurt the SEC’s ongoing case against Ripple for failing to register their XRP token as a security– Ripple’s defense would of course attempt comparison with Ethereum. The SEC is also currently probing whether Binance (the most popular crypto exchange) should have registered its token BNB (currently 5th ranked crypto market cap) as a security in its initial coin offering (ICO) back in 2017. According to the report, “one of the SEC’s focuses is on whether Binance.US is wholly independent of the global exchange and whether employees may be involved in insider trading.” Gensler and the SEC have doubled the size of its crypto enforcement unit and are also reportedly planning greater regulation of exchanges– requiring them to register with the SEC and segregate custody and market-making functions.

On June 7, senators Cynthia Lummis (R-Wyo.) and Kirsten Gillibrand (D-N.Y.) proposed the Responsible Financial Innovation Act on June 7, which seeks to assign regulatory authority over digital assets to the Commodity Futures Trading Commission (CFTC) rather than the Securities Exchange Commission (SEC). If passed, many believe cryptocurrency could see a less strict and more accommodative regulatory environment. Advocates argue that regulations surrounding securities are too strict and too tailored for the well-developed traditional equities market.

At the June 23rd U.S. Congressional Committee hearing, Representative Austin Scott posed that neither the SEC nor the CFTC have the requisite manpower, saying “it’s not possible to regulate all these currencies.” Technology founder Charles Hoskinson agreed, arguing for a “public-private partnership” where compliance should be left to the software developers. “It’s not the SEC or CFTC going out there doing KYC/AML; it’s banks. They are the ones on the front line.” Because digital assets can store and transmit meta-data, they could perform much of the regulatory function automatically. Hoskinson also argued that because digital assets are “more fundamental than a particular category (like a currency or a commodity),” regulatory bodies should avoid binary classification and instead refocus broadly on “what things … we want to guard against.”

While the federal government is still working on its approach, state legislatures have moved forward with their approaches to the industry.  Lobbying from the crypto-industry has seen a large uptick, contributing to a notably accommodative trend across most state legislatures as they seek to attract the industry. The biggest exception is New York, whose regulatory provisions remain among the strictest.  States like Colorado, Wyoming, Florida, and North Carolina have even legislated securities and consumer protection exemptions for crypto-companies– which some consumer-protection advocates argue is going too far.

Irrespective of the final regulatory outcomes, perhaps most important is that we are now much closer to finding regulatory clarity in what has historically been very murky. Institutions can then feel more comfortable moving forward with cryptocurrency-related endeavors with lessened fear of regulatory risk. Indeed, the timing of these landmark regulatory developments coincides with prominent US financial institutions wanting to enter the fray. Goldman Sachs is considering a venture into derivatives in a deal with the FTX crypto exchange; while Citadel, Charles Schwab, and Fidelity are reportedly partnering to build a cryptocurrency trading platform.


[1] Presumably because NFTs are not clearly securities, the DOJ has not charged standard violation of Section 10(b) of the Securities Exchange Act here. Instead, it charged wire fraud under 18 USC 1343. This could set an important precedent.


The views expressed represent the opinion of Passage Global Capital Management, LLC. The views are subject to change and are not intended as a forecast or guarantee of future results. This material is for informational purposes only. It does not constitute as investment advice and is not intended as an endorsement of any specific investment. Stated information is derived from proprietary and nonproprietary sources that have not been independently verified for accuracy or completeness. While Passage Global Capital Management, LLC believes the information to be accurate and reliable, we do not claim or have responsibility for its completeness, accuracy, or reliability. Statements of future expectations, estimates, projections, and other forward-looking statements are based on available information and Passage Global Capital Management, LLC’s views as of the time of these statements. Accordingly, such statements are inherently speculative as they are based on assumption that may involve known and unknown risks and uncertainties. Actual results, performance or events may differ materially from those expressed or implied in such statements.

Categories
Uncategorized

Increasing Interest Rate Impact

The majority of investors are well-informed of the headwinds facing financial markets, primarily elevated inflation in combination with tightening monetary conditions. Most have felt a damaging impact on their investments, especially since many of the successful strategies utilized in bull markets are now ineffective. Younger investors have never experienced such a substantial rising rate environment. On May 4th, the Fed implemented a half-percentage-point rate increase, which is the largest since 2000, and they are doing so at the fastest pace in over three decades. If they continue down this direction with additional half-point increases, rather than the typical quarter-point increase, this would be the most aggressive pace for policy-tightening since the 1980s. Many criticize the Fed for believing that inflation was transitory and for having a delayed response in combatting it. The most well-known tool in the Fed’s arsenal to fight inflation is interest rates. The short-term interest rate, also known as the Fed Funds rate, is directly controlled by the Federal Reserve. When the Fed raises this rate, it becomes more expensive to borrow money, which results in less investment and consumer spending. The current inflationary environment is a result of aggregate demand exceeding supply, so by raising interest rates, the Fed is attempting to push down this demand to stabilize prices. However, it is of course not that simple. Price stability is only one half of the Fed’s dual mandate; the other half is to promote maximum sustainable employment. If the Fed does not handle the rate hikes correctly, the economy could slow down much too quickly. Workers could lose their jobs, and the unemployment rate may increase; it could possibly even result in a recession. Therefore, it is important to be informed on current investor sentiment and involvement in the market as well as how certain investments have historically performed in rising rate environments.

Recently, there was an inflow of investors in the market who have jumped in on “buying the dip.” Many investments that performed very well before this year’s selloff, such as the ARK Innovation ETF from Cathie Wood, have now plummeted. Despite this, investors have remained resilient and asset flows indicate that the general strategy of investors during this interest rate-hike environment is drastically different than it has been in the past. Historically, when the S&P500 has suffered such a decline like what is happening now, investors sold nearly $10 billion in the first twelve weeks after the market peak. Now, on the contrary, investors recently invested an additional $114 billion as the S&P500 was dropping into bear market territory. This March, a record for the largest monthly sum was reached when there was an inflow of $28 billion in exchange traded funds and U.S. stocks. Following that, investors hit a one-day record when they invested about $2.6 billion in the same asset classes.1 There is an evident shift in investor sentiment compared to the past, and a reason for this relates to the financial crisis of 2008.

Unfortunately, investors that sold out of panic in the crisis later regretted their decision. Not only did they lock in their losses, but afterwards, there was an extended bull market where the S&P500 soared nearly 400%. This experience has left modern-day investors more optimistic in holding onto their assets for the long-term. Although they are confident, some investors’ positivity is beginning to deteriorate. The current selloff is becoming prolonged compared to the most recent bear market in 2020, which only existed for roughly 23 trading days. Many individuals who “bought the dip” this time continue to suffer losses. It is impossible to know how far the dip will go, and this leaves investors who have cash on the sidelines with the complex decision of when to wade into the market.

It is important to know how certain asset classes have performed in the past when interest rates were on the rise (keeping in mind that past results are not a guarantee of the future). Additionally, there is no rulebook detailing what to do when interest rates rise, and there is not a single strategy that will work for every investor. If you have created a sound financial plan you are comfortable with for the long-haul, then you should stick with it and may need to only make minor changes to weather the current storm. Generally, when interest rates rise, fixed income investments will decline in value; a common principle is that bond prices and interest rates tend to move in opposite directions. Bonds’ sensitivity to interest rate changes is measured by duration. A higher duration implies higher interest rate risk. For example, longer-maturity bonds will be more sensitive to movements in interest rates compared to shorter-maturity bonds, all else equal. If a fixed income strategy has a shorter duration, then it has less exposure to rising rates. In regard to Treasury bonds, many consider these to be a safe-haven due to their lack of default risk, which is the risk that the borrower will be unable to make the required payments on principal and interest to the lender. Aside from interest rate risk, the other primary risk to Treasury bonds is inflation. Higher inflation erodes purchasing power and therefore makes fixed coupon and principal payments less valuable to the bond owner. Corporate bonds have these risks as well but are considered riskier than Treasury bonds since they also have default risk. Unintuitively, however, corporate bonds have typically performed better during times of interest rate increases compared to Treasury bonds. This is due to credit spreads. Credit spreads are the differences in yields between corporate and Treasury bonds. Credit spreads measure how much extra return an investor requires for accepting default risk. When credit spreads shrink, corporate bonds benefit because investors are more willing to take on default risk. Generally, the economy is still strong when the Fed raises rates, and credit spreads typically narrow when the economy is strong. Hence, corporate bonds have performed better in these times historically.

There are alternative fixed-income options to traditional, fixed-coupon bonds as well. For example, interest rate hedged bond ETFs aim to eliminate any form of interest rate risk by incorporating hedges specifically targeted at rising rates. However, these limit profit opportunity when rates fall. Floating rate investment grade bonds also have very little exposure to movements in rates, so a substantial portion of interest rate risk is eliminated during rising rate environments. TIPS, or Treasury Inflation Protected Securities, have been in the spotlight recently due to current inflation levels. One caveat is that these are meant to hedge against inflation expectations, not against realized inflation, and they do not protect against changes in real interest rates. However, TIPS outperformed Treasuries when the Fed increased rates in the past.2

Investors should not pick one asset class for their portfolio. Rather, they should take a multi-asset approach. Shifting away from fixed-income strategies, equities do not necessarily always struggle in times of rising interest rates. Historically, when rates rise, the financial, industrials, materials, and energy sectors have been top performers.2 Value stocks can also perform well compared to growth stocks in rising rate environments. The former is composed of companies with stock prices near or below the intrinsic value of the business whereas the latter relies on estimates of future cash flows to derive value. However, as interest rates rise, future cash flows become less valuable in present value terms, so investors have more appetite for current, stable cash flows like those found in value stocks.

Of course, every rate hiking cycle is different, and asset classes that outperform in one environment may not continue to do so in the future. Each investment has its own specific risks, and there are other factors to consider in every decision rather than just rising rates. Speak with Passage Global Capital Management to learn about the risks of investing in a rising interest rate environment and how they can be properly managed.


1Banerji, Gunjan and McCabe, Caitlin. Buy the Dip Believers Are Tested by Market’s Downward Slide.” Wall Street Journal. May 10, 2022.

2 ”A Playbook for Rising Interest Rates.” ProShares. 2022.


The views expressed represent the opinion of Passage Global Capital Management, LLC. The views are subject to change and are not intended as a forecast or guarantee of future results. This material is for informational purposes only. It does not constitute as investment advice and is not intended as an endorsement of any specific investment. Stated information is derived from proprietary and nonproprietary sources that have not been independently verified for accuracy or completeness. While Passage Global Capital Management, LLC believes the information to be accurate and reliable, we do not claim or have responsibility for its completeness, accuracy, or reliability. Statements of future expectations, estimates, projections, and other forward-looking statements are based on available information and Passage Global Capital Management, LLC’s views as of the time of these statements. Accordingly, such statements are inherently speculative as they are based on assumption that may involve known and unknown risks and uncertainties. Actual results, performance or events may differ materially from those expressed or implied in such statements.


Categories
Uncategorized

Market Corrections are Inevitable; Panic Selling Shouldn’t Be

Investors can quickly become panicked when they see the stock market experiencing a market correction, or even more daunting, entering bear market territory. The market recently experienced a correction, but these events are more common than one may think. Although the past is no guarantee of the future, over the last century, the market has recovered from drawdowns and provided higher gains for long-term investors. Market corrections are inevitable, and they are bound to happen multiple times during every investor’s life. It is easy to become negatively influenced and anxious during times of market turmoil, but rather than acting out of fear, learning the facts about similar events will provide you with a more encouraging mindset. Experienced investors are more likely to be well-informed on volatility and past market behaviors, so they are able to stay committed to their investment strategy. Having this beneficial knowledge will allow you to look past the discomfort more easily to avoid the urge to respond in a costly manner that you may later regret.

A major stock index, such as the S&P 500 or the DJIA, experiences a market correction when it falls more than 10%, but less than 20%, from a recent peak. When the decline exceeds 20%, the index enters bear market territory, which involves a higher degree of detrimental impact compared to a market correction. Market corrections are generally caused by current factors that disrupt the markets; these factors are typically temporary and quickly fade. On the contrary, bear markets are more likely to be the result of substantial imbalances that have built up over the years. These may coincide with recessions, defined as at least two consecutive quarters of decline in Gross Domestic Product (GDP), which is a measure of general economic health. Fortunately, bull markets generally last longer than bear markets and corrections. The average bull market lasts 8.9 years, whereas the average bear market lasts 1.4 years. Market corrections can be viewed as short-lived market setbacks that occur over a few months, and they are called “corrections” because the markets historically “correct” themselves where prices return to their longer-term trend. Market corrections are undeniably going to continue and affect most investors’ lives at some point. Many may find this frightening, but actually in a lot of cases, market corrections have acted as a healthy reset for investor expectations and stock valuations.

Overall, predicting stock market behavior is beyond difficult, and if incorrect, an investor may experience tremendous opportunity cost. Educated investors know that time in the market beats trying to time the market. To corroborate this point, a research study1 from J.P. Morgan found that “investors who missed the top 10 trading days during a recent 20-year stretch would have seen their returns fall by almost half, compared to those who stayed invested the whole time.” It is accurate to conclude that market corrections may damage short-term investors, but for long-term investors, they often provide buying opportunities. Times as this cause discomfort, but it is normal. Investors have to “pay to play”, and sometimes that means going through short-term discomfort to experience long-term success.

Financial markets kicked off 2022 with turmoil, where the economy is encountering a rise in geopolitical tensions, a four-decade high inflation rate, COVID-19 impacts, and interest rate hikes from the Fed – to name a few headwinds. The last factor is critical. The majority of market corrections happen during rate hiking cycles. Of course, the dynamic between the Fed Funds rate, economy, and stock market is complicated and may be different across cycles. So far this year, all three major stock market indexes, the S&P 500, the Dow Jones Industrial Average, and the tech-heavy NASDAQ, suffered corrections with the latter entering bear-market territory. However, the discomfort of market underperformance today may be softened for the average investor due to a tight labor market and strong consumer balance sheets. Additionally, market performance is ultimately driven by fundamentals such as corporate revenue and earnings. For 2022, investors will continue to stay up to date on a variety of risk factors including the Fed monetary policy, consumer spending, COVID-19, and the Russia-Ukraine crisis, but the most alarming of all is the persistently high inflation rate. Although markets do move faster than they have in the past, we can analyze past market corrections to get a better understanding of how the market may behave in the future.

Since 1950, there have been approximately 39 market corrections.2 The stock market does not follow the pattern of averages, but to put it in perspective, that is equivalent to a double-digit decline occurring in the S&P about every 1.85 years. On average, a stock market correction will take 6 months to reach its trough. 7 of those corrections took more than a year to reach its bottom, and 24 of them took approximately 3.5 months. Additionally, 6 of these 39 corrections occurred in the 2010’s. However, over the 2010 decade, the S&P 500 received a total return of about 256%; this alone proves how the market rebounded and rewarded investors who stuck it out with outstanding gains. Another example is 2018, when the S&P 500 plummeted more than 10% in the first and fourth quarter. This was abruptly followed by a rebound of over 13% in the first quarter of 2019. In the bear market between 2007 and 2009, the S&P 500 declined over 48%. On a brighter note, the S&P 500 was up 68.6% from the low point one year later and up a total of 95.4% 2 years later. Market corrections are actually extremely common. When looking at 2002 through 2021, there has been a decline of more than 10% in 10 of those 20 years – or 50% of the time. In 2 other years in that timeline, the decline was very close to 10%. Even though the markets experienced these deep falls from 2002 to 2021, they rose and provided positive returns in all but 3 years. A report from Crestmont Research3 looked into the years of 1919 to 2021 to analyze the rolling 20-year average annual total returns. The results are optimistic, as it was found that the “S&P 500 always made money for investors on a total-return basis if they held for at least 20 years”. Out of all these years, only 2 of them ended with an average annual total return of less than 5%, and more than 40 of those years ended between 10.8% and 17.1%. Furthermore, we can examine how the market tends to perform after exiting the market correction. Using data beginning in 1928, the S&P 500 had an average gain of nearly 14% one year after a market correction. One of the quickest and deepest corrections was during COVID-19, but this was also one of the speediest recoveries. In the span of a few weeks, the S&P 500 lost 30%, but it then regained all of that loss within 5 months. Within one year following the bottom of this correction, the value of the S&P 500 doubled. This example, as well as all the others, prove that market corrections are common, and that investors should avoid attempting to “fix” the correction. As mentioned, panic moves will lock in your losses and you will lose out on the future gains from recovery. Investors can benefit from understanding these historical tendencies. The market has volatility and times such as this are normal, so it is important for long-term investors to remain confident in their investment strategy.


1 Azzarello, Samantha and Roy, Katherine. “Impact of being out of the market.” J.P. Morgan Asset Management, 5 June 2020.

2 Williams, Sean. “How Long Do Stock Market Corrections Last?” The Motley Fool, 20 March 2022.

3 “Returns Over 20-Year Periods Vary Significantly; Affected by the Starting P/E Ratio.” Crestmont Research. 2022.


The views expressed represent the opinion of Passage Global Capital Management, LLC. The views are subject to change and are not intended as a forecast or guarantee of future results. This material is for informational purposes only. It does not constitute as investment advice and is not intended as an endorsement of any specific investment. Stated information is derived from proprietary and nonproprietary sources that have not been independently verified for accuracy or completeness. While Passage Global Capital Management, LLC believes the information to be accurate and reliable, we do not claim or have responsibility for its completeness, accuracy, or reliability. Statements of future expectations, estimates, projections, and other forward-looking statements are based on available information and Passage Global Capital Management, LLC’s views as of the time of these statements. Accordingly, such statements are inherently speculative as they are based on assumption that may involve known and unknown risks and uncertainties. Actual results, performance or events may differ materially from those expressed or implied in such statements.

Categories
Uncategorized

Stock Market Behavior in Times of War

With the devastating ongoing war in Ukraine, one concern among investors is how this may affect their investments. Since the end of 2020, investors have grappled with several headwinds in the markets, from historically high rates of inflation to supply chain disruptions. Now, this geopolitical conflict has instilled more uncertainty into the minds of investors and has contributed to an escalation of volatility from the start of this year.  Although investing in such times as this can be daunting, to panic and sell because the stock market has dropped can be one of the most substantial mistakes an investor could make. Rather, volatility can provide long-term buying opportunities to invest in high quality stocks at attractive prices. Additionally, although past results are no guarantee of the future, historical events have shown that drops are often followed by steady gains. Trepidation is natural, but it may be comforting to be informed on how the markets have behaved in previous times of conflict and war. We will take a more in-depth assessment into the current situation, other factors that contribute to stock market volatility, and how the stock market has previously behaved in other wars.

Any declaration of war has global repercussions, but it is important to note that there are a variety of other factors that are responsible for stock market behavior. Currently, many areas of the market have already fallen into correction territory, with the Nasdaq 100 index hitting the bear market level. On the contrary, defensive and energy stocks have recently performed well. Many investors have begun putting their trust into precious metal investments, such as gold, which may add protection to a portfolio during times of uncertainty. Some investors believe that Bitcoin is comparative to digital gold.  They believe it will act as a hedge against inflation and serve as a diversifier to stocks; however, in recent times, Bitcoin prices have been highly correlated with stock prices.

The United States and other nations have issued sanctions against Putin and Russia, in an aim to erode their economy as punishment for the invasion of Ukraine. Given that Russia is the world’s third-largest oil producer, these sanctions may elevate energy prices even higher while threatening the global oil supply if Russia shuts off pipelines or suffers infrastructure damage. Upon Russia’s invasion, many commodity prices, including oil and grains rose. Furthermore, the pandemic has already significantly affected the global supply chain and a full-scale conflict may further disrupt it, adding to the high prices. If the ports surrounding the Baltic and Black Seas are interrupted, the shipping crisis may further continue. The Biden Administration has enforced other penalties as well, including the blacklisting of major Russian banks to hamper their ability to globally operate, a travel ban and asset freeze on Putin, and export control on specific technology products to Russia. Other factors relating to a war that will affect stock market behavior include the nations involved, location of the conflict, when it is occurring, length of conflict, and the public support for a war. Typically, when a conflict lasts longer, the market will reflect less of its impact. The increased likelihood of an armed conflict tends to decrease stock prices, but it does this even more so if this conflict is unexpected and comes as a surprise.

Skeptical investors often panic and sell their investments in volatile times due to the fear that a war will have a long-term negative impact on their portfolio. However, this is a common misconception because generally, U.S. stocks will plunge at the outbreak of war and then they typically recover. To examine this, we can take a deeper look at previous periods of wars and how the stock market has behaved. This may act as a gauge to be better informed on what to expect in regards to the crisis in Ukraine. Although we can look at historical events, it is important to note that this does not guarantee the future, there are other factors influencing the stock market, and the global economy may have looked differently depending on the time period. With the beginning of World War I in Europe, investors became spooked which resulted in panic selling. The DJIA dropped 30%, so in order to maintain stability, the New York Stock Exchange was shut down for months. Eventually, the markets reopened and the DJIA increased by 88% before suffering from 1917 to 1918. In mid-1919, the markets underwent a tremendous recovery. World War II was the most expensive war to date which threatened the economy. However, at the end of the war in 1945, the DJIA was up by 50%, which is equivalent to about 7% annualized growth from 1939 to 1945. The Korean War, which came as a shock to many, resulted in the DJIA dropping by 4.7% on a single day after North Korea’s initial attack. Additionally, consumers had to deal with inflation near 11%. By the end of the war, the DJIA was up close to 60%, which is an annualized growth rate of 16%. The DJIA fell over 5% in the first few days of the Cuban Missile Crisis in October 1962 but gained nearly 17% from there to end of year. One of the most unpopular wars in U.S. history is the Vietnam War. In 1965, U.S. troops entered Vietnam and the last troops left in 1973. During this time period, there were many drastic events that occurred, including a mild recession in 1970. However, when looking at the bigger picture, the Dow actually grew 43% during these years, producing a mild annualized return of about 4%. More recently, the war in Afghanistan is more difficult to assess due to its prolonged lifespan and the events in between. However, one takeaway is that defense stocks outperformed the larger market by 58%. Of course, the major caveat in the historical data is that there has never been a direct war between two nuclear powers. However, overall, historically stock prices tend to decline in the pre-war phase and typically recover quickly. Pre-war volatility does not generally last, and investors can experience buying opportunities and long-term stability. For investments, panicking and selling has typically been proven to be one of the worst actions you can take. Times of uncertainty are frightening, but most investors will receive even harsher losses if they cannot be patient and go through periods of turbulence to experience the long-term gains. In conclusion, investors need to be patient and exchange short- term pain for long tern gain.


Sources:

Ben Carlson. “The Relationship between War & the Stock Market.” A Wealth of Common Sense, 14 Jan. 2020, https://awealthofcommonsense.com/2020/01/the-relationship-between-war-the-stock-market/.


The views expressed represent the opinion of Passage Global Capital Management, LLC. The views are subject to change and are not intended as a forecast or guarantee of future results. This material is for informational purposes only. It does not constitute as investment advice and is not intended as an endorsement of any specific investment. Stated information is derived from proprietary and nonproprietary sources that have not been independently verified for accuracy or completeness. While Passage Global Capital Management, LLC believes the information to be accurate and reliable, we do not claim or have responsibility for its completeness, accuracy, or reliability. Statements of future expectations, estimates, projections, and other forward-looking statements are based on available information and Passage Global Capital Management, LLC’s views as of the time of these statements. Accordingly, such statements are inherently speculative as they are based on assumption that may involve known and unknown risks and uncertainties. Actual results, performance or events may differ materially from those expressed or implied in such statements.


Categories
Uncategorized

Rising Rates and Risk Measurements

Inflation has reached a 40-year high with consumer prices and wages reaching excessive levels, competing in a wage-price spiral. With inflation running well above the 2% target, 2022 will consist of the Federal Reserve fighting for their credibility. It is anticipated that the Fed will raise interest rates at consecutive policy meetings for the first time since 2006, and a half-percentage-point increase, which has not been done since 2000, has not been fully ruled out. Some investors are fearful that Fed Chairman Jerome Powell will lead the economy into a recession in the effort to quell inflation. The Fed hasn’t had to combat inflation of this magnitude since the 1980’s, and historically when inflation has been this high, the Fed has not been able to push it down without a subsequent recession. Even with the Fed’s efforts, inflation may remain high due to factors outside of the Fed’s control, such as worsened shipping delays and supply chain issues from the pandemic. As an investor, it is critical to have an experienced portfolio manager guiding your investments. Portfolio managers must implement risk management techniques to evaluate the potential impact that these negative events can have on your portfolio, and to ensure that you are not exceeding your desired risk tolerance. Risk measurements and models, including VaR, modified versions of VaR, scenario analysis, and stress testing can provide insights focused on these concerns.

Skillful portfolio managers may utilize risk models in combination with their judgement to exploit the strengths and limitations of your portfolio. VaR, or value at risk, is the minimum loss of portfolio value that would be expected to occur a specific percentage of the time over a certain period of time. This is easier to understand with an example. A 5% daily VaR of $1,000 would mean that on 5% of days, a portfolio is expected to lose at least $1,000.  Portfolio managers have the flexibility to choose the best  percentage threshold and time horizon (e.g., daily, monthly, yearly, etc.) to meet their requirements.

An effective portfolio manager must understand the advantages of VaR, but also its limitations. VaR is a simple, yet valuable risk measure that allows one to see the potential losses that can danger a portfolio. There is a substantial amount of information shown in a single number. This number can provide a basis for risk comparison across asset classes and portfolios to see where the majority of risk is emanated from. This allows a portfolio manager to see adjustments they may need to make to realign its VaR, or they may realize that a reallocation of the portfolio is necessary. Although useful, VaR does require discretionary choices, such as choosing the data sources. There also may be more extreme, “left-tail events” that occur which VaR may not capture. VaR also has difficulty taking illiquid assets into account and is often understated for these assets. It is also important to understand that VaR does not portray the worst-case scenario and that losses can exceed it. It is also sensitive to correlation risk. Correlation risk is the risk that when markets are under extreme stress, correlations among assets tend to rise which can significantly decrease diversification benefits in a portfolio. VaR can be oversimplified, and these limitations are not unique to this specific risk measure. However, if a portfolio manager fully understands this, they can still receive valuable information. Rather than using VaR by itself, risk management is most effective with a combination of risk measurements and models.

A portfolio manager cannot obtain all the necessary information through one single risk measure; there are numerous variations of VaR that aim to provide additional information where VaR lacks. CVaR, also referred to as conditional VaR, expected tail loss, or expected shortfall, represents the average loss that would occur in the left tail of the distribution whereas traditional VaR only represents the minimum loss. For example, consider the aforementioned portfolio with a 5% VaR of $1,000. The CVaR of this portfolio will be more than $1,000. VaR represents the minimum loss on the worst 5% of days whereas CVaR represents the average loss on those same days. CVaR can be more useful to a portfolio manager than VaR since it captures more information about the extreme left tail of the distribution. IVaR, or incremental VaR, determines how the VaR will change if a certain position size in the portfolio is altered relative to the other positions or if a position is added or removed. If a portfolio manager wants to increase a holding in the portfolio, they would recalculate the VaR under the assumption that this change has been made. The IVaR is calculated by finding the difference between the before VaR and the after VaR, which reflects how VaR is affected due to this certain change. A portfolio manager can compare the new VaR, whether it is higher or lower, and make any changes they see as beneficial for the portfolio. MVaR, or marginal VaR, can be used to determine how each asset contributes to the VaR; it measures the change in VaR when a very small alteration is made in a portfolio position. Although IVaR and MVaR are both risk measurements that determine the impact of an anticipated change, MVaR is more focused on smaller changes within the portfolio. The last variation of VaR is the ex-ante tracking error, also known as relative VaR. The ex-ante tracking error delineates the degree to which the performance of a portfolio may deviate from its benchmark. Although VaR and its variations support the risk management process, a portfolio manager must also understand the factors that are driving the risk.

Scenario analysis and stress testing can allow portfolio managers to analyze the risk drivers and address the shortcomings of other probabilistic risk measures. A scenario analysis can look at any event and evaluate how a portfolio may perform under these conditions. This risk model has two different methods: historical and hypothetical. A historical scenario analysis looks at what the return on a portfolio would be if a repeat of an event in history, such as The Great Inflation, were to occur. To determine this return, the value of each portfolio position is calculated before and after the changes to see the effect. This analysis can be run over a timeline to include different actions the portfolio manager may make throughout this event to alleviate the potential repercussions. Alternately, a stress test allows the portfolio manager to change multiple variables at once. This allows a portfolio manager to apply extreme, negative stress to a portfolio and assess the impact. This is a productive way to reflect on the impact that certain adverse market movements may have on a portfolio. However, it is unlikely that a historical event would happen in the exact way that it once did. The solution to this is a hypothetical scenario analysis, where one can evaluate the impact of an event that has not previously occurred on an investment portfolio. To construct a reliable hypothetical scenario, one must complete a reverse stress test, which involves targeting exposures to determine how they behave in different environments. Scenario analysis and stress testing provide an opportunity to review the potential impact from events and to understand the risk exposures. There is no certainty to how the markets will behave, and hypothetical scenario analysis, in combination with the other risk measurements, can provide a portfolio manager with a framework to best prepare for varying market conditions.


The views expressed represent the opinion of Passage Global Capital Management, LLC. The views are subject to change and are not intended as a forecast or guarantee of future results. This material is for informational purposes only. It does not constitute as investment advice and is not intended as an endorsement of any specific investment. Stated information is derived from proprietary and nonproprietary sources that have not been independently verified for accuracy or completeness. While Passage Global Capital Management, LLC believes the information to be accurate and reliable, we do not claim or have responsibility for its completeness, accuracy, or reliability. Statements of future expectations, estimates, projections, and other forward-looking statements are based on available information and Passage Global Capital Management, LLC’s views as of the time of these statements. Accordingly, such statements are inherently speculative as they are based on assumption that may involve known and unknown risks and uncertainties. Actual results, performance or events may differ materially from those expressed or implied in such statements.