Categories
Uncategorized

Fed’s Rate-Effect Lag Conundrum

When the Fed ended its two-day November policy meeting, it raised the target federal funds rate by three-quarters of a point for a fourth straight time. Its key rate now stands in a range of 3.75% to 4%, the highest in 15 years. It was the central bank’s sixth rate hike since January of this year, which is the fastest pace in decades as it continues its fight to beat back elevated and persistent inflation by slowing economic growth. Investors hoping for the Fed to signal a more dovish tone were disappointed by Federal Reserve Chairman Jerome Powell’s message that rates would stay higher for longer to battle inflation. The year-over-year inflation is currently more than 8%, far above the Fed’s 2% target with few signs yet of cooling off. Core CPI, which strips out the volatile food and energy components accelerated 0.6% in September and was up 6.6% from a year ago, which was the highest pace since August 1982.

However, these rate hikes work with “long and variable lags.” The phrase was coined by famous Nobel-prizewinning American economist Milton Friedman to explain the delayed and uncertain effects of monetary policy in the economy. Raising rates should cause growth to slow down and in turn should lead to lower inflation. However, it can take time for the full impact to be felt; hence Friedman’s idea of a long lag. The variability, meanwhile, refers to the lack of a predictable interval between rate hikes and their  results. As a matter of fact, The International Monetary Fund said last month that interest rate changes have their peak effect on economic growth in about one year and on inflation in three to four years. In the U.K., a 1 percentage-point increase in the policy rate reduces output by 0.6% and inflation by up to 1 percentage point after two to three years, according to a 2016 paper by James Cloyne, then of the Bank of England, and Patrick Hürtgen of Germany’s Bundesbank.

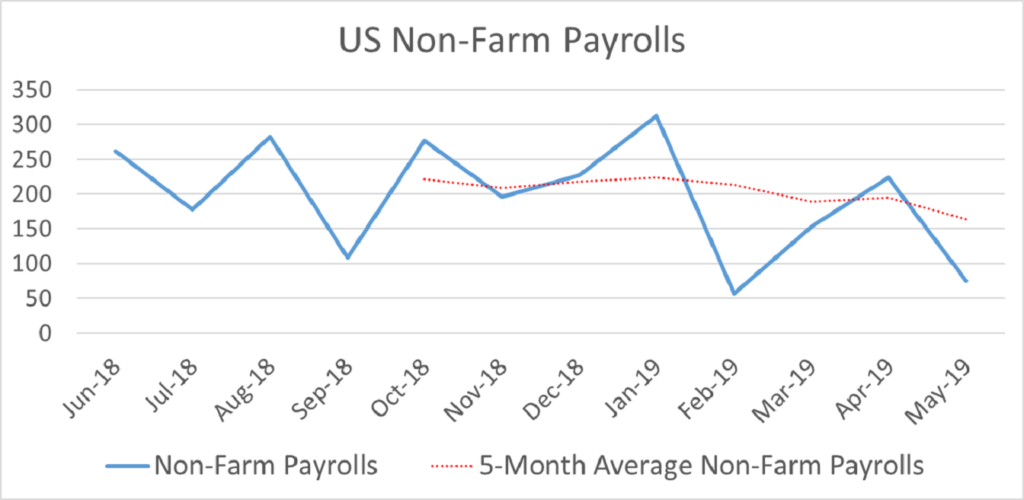
This means that the effects of the global expansionary monetary policies implemented in response to the Covid-19 pandemic induced recession are still being felt. These policies were designed to increase the supply of money and credit to generate economic growth. Meanwhile, the recent consecutive rate hikes have barely cooled either inflation or the labor market at this point.

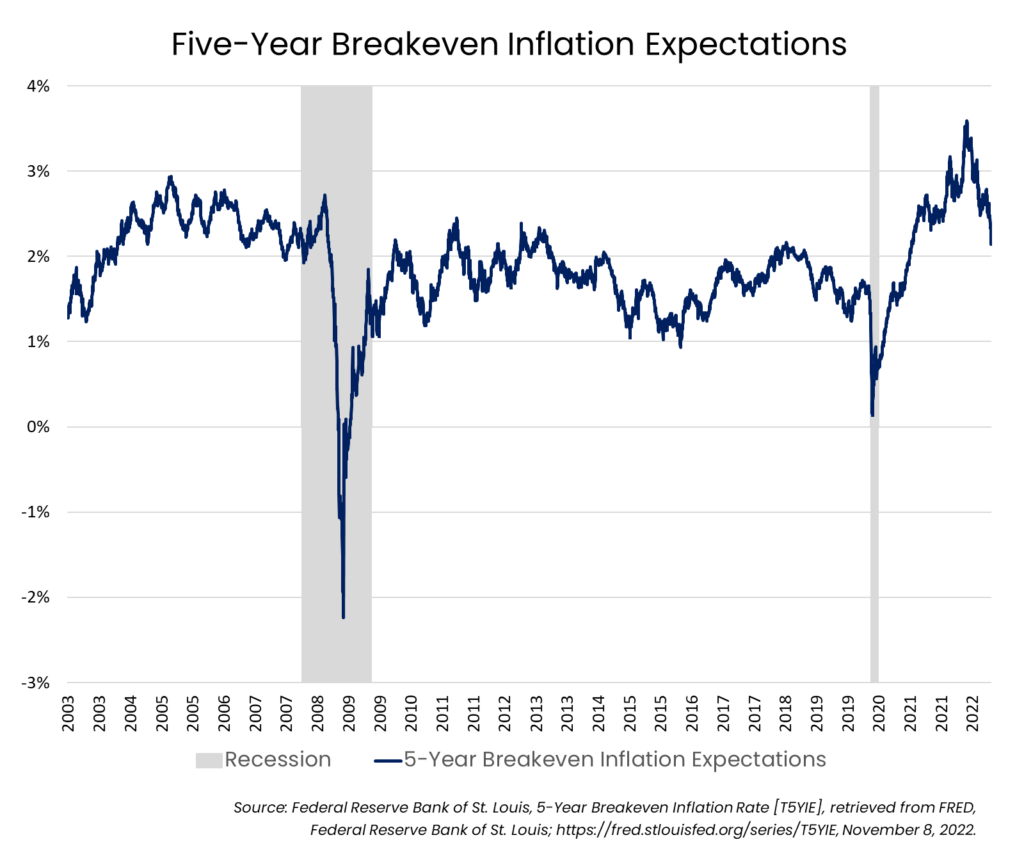
However, investors and economists are expecting the Federal Reserve’s aggressive interest rate increases to eventually curtail inflation. A widely followed measure of investors’ annual inflation expectations over the next five years, the five-year break-even inflation rate, stood at 2.61% in early November. It reached a record high of 3.59% in March of 2022, and since then it has been coming down gradually, implying investors expect inflation to decline significantly over the next five years. The record low was -2.24% in November of 2008.

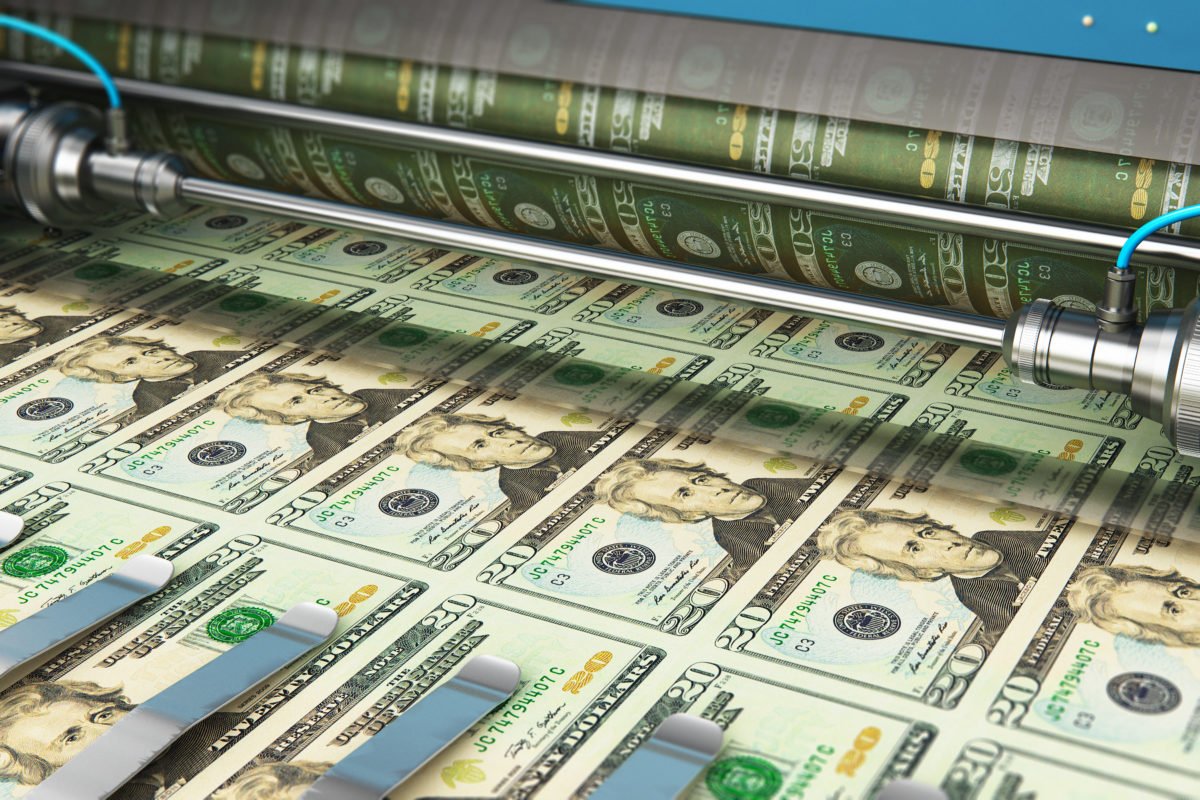
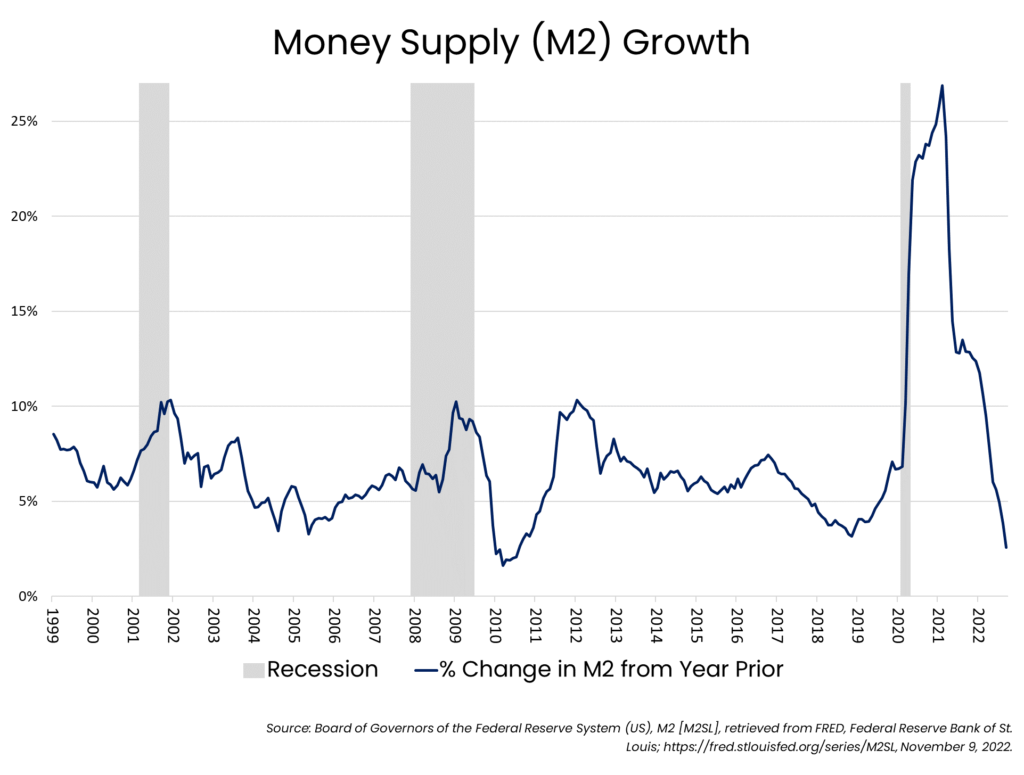
Another economic metric indicates an impending economic slump and a looming recession. In recent months, a measure of the money supply called M2 that includes cash, checking deposits, and easily-convertible near money has been falling. In September, the M2 growth rate was 2.56 percent. That’s down from August’s growth rate of 3.82 percent. September’s rate was also well down from September 2021’s rate of 12.87 percent. Recessions tend to be preceded by decelerating money supply. However, the money supply growth rate has a tendency to subsequently start ticking up again before the onset of recession.

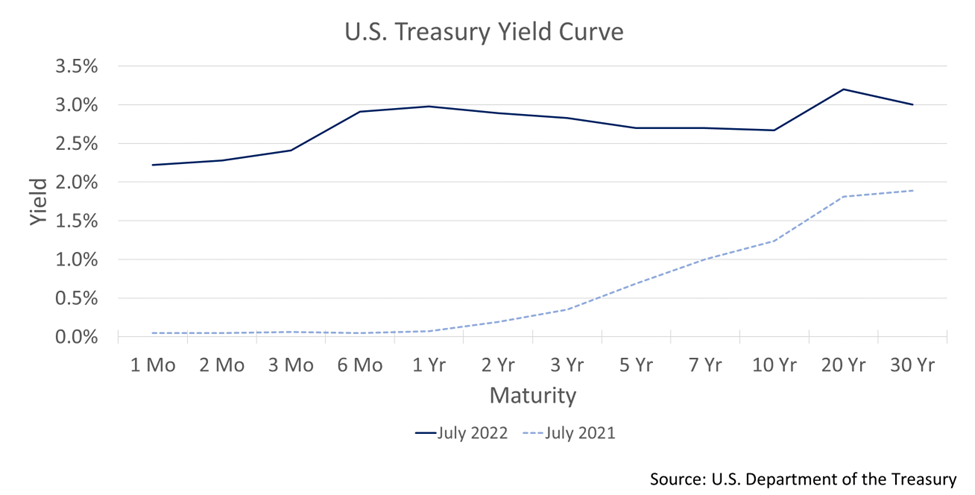
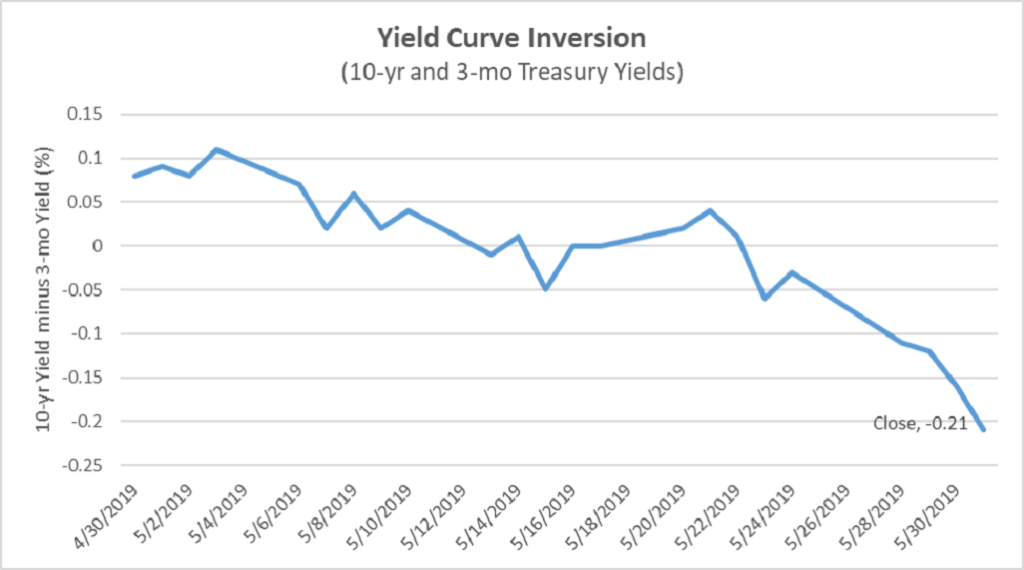
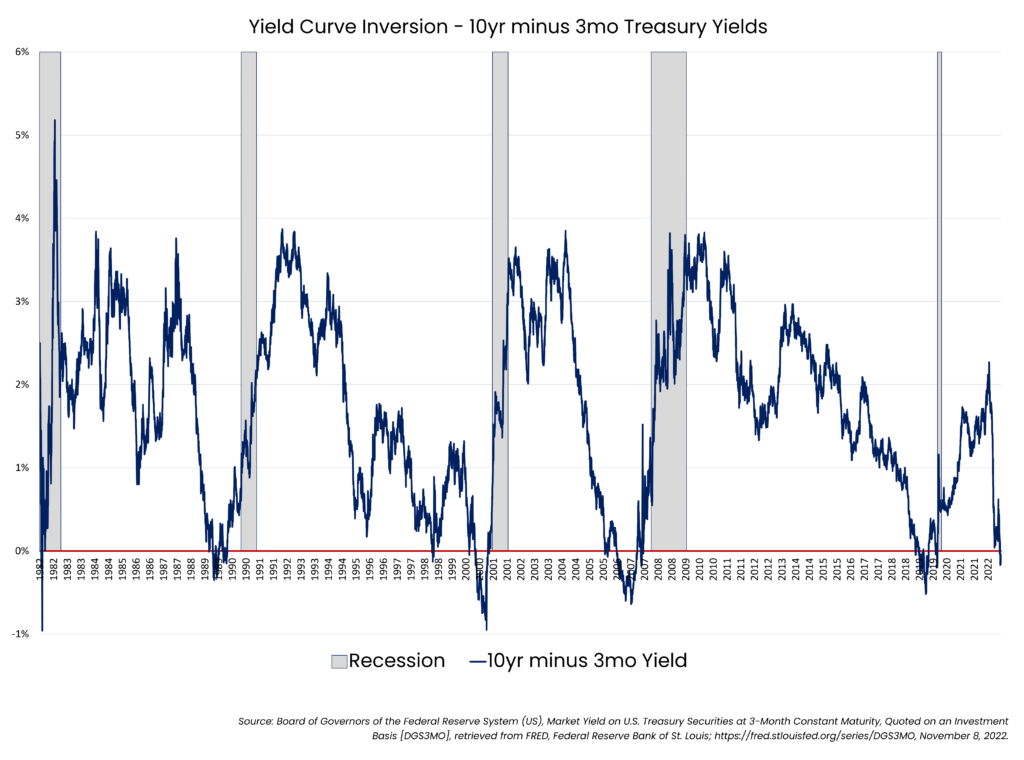
It is no surprise that key yield-curve indicators favored by Wall Street have also started to signal that the United States is heading towards an economic slump – perhaps within a year.  In October, 10-year Treasury yields fell below 3-month Treasury yields, creating a so-called yield curve inversion. This signals that investors desire more compensation for buying short-term bonds as compared to longer-term bonds in response to the Fed’s rate hikes and slower anticipated growth. An inversion occurred earlier this year between 10-year and 2-year Treasuries, and in early November, the spread between these yields touched a level not seen since the early 1980s.

The Fed is well aware of the rate-effect lag, and this could create the risk that the Fed might ease off too soon. This is especially true if the hot job market starts to cool and people begin losing their jobs. Recent announcements of some technology companies cutting their workforce, including Twitter and Meta’s upcoming large-scale layoffs, could spill over to other industries. This could prompt a reaction from the Fed to stop increasing rates too early while prices are still rising. Investors may then conclude the Fed isn’t committed to fighting inflation. This would hurt their credibility, especially when they were too slow to begin raising interest rates in the first place.

But lags carry the opposite problem, too. The Fed could instead keep increasing and holding interest rates too high for too long to preserve their credibility, especially if upcoming inflation data continues to run hot as we’ve seen recently, risking potentially a deeper recession than is necessary.

This rate-effect lag is the conundrum facing the Federal Reserve today and let’s hope  the Fed can still achieve a so-called “soft-landing.” Policy mistakes from the Fed in the United States may have more profound ripple effects for the global economy. If you are a student of world affairs, you may know the phrase “when America sneezes, the world catches a cold.” Let’s hope that no one gets a cold before we head into the winter months.


The views expressed represent the opinion of Passage Global Capital Management, LLC. The views are subject to change and are not intended as a forecast or guarantee of future results. This material is for informational purposes only. It does not constitute investment advice and is not intended as an endorsement of any specific investment. Stated information is derived from proprietary and nonproprietary sources that have not been independently verified for accuracy or completeness. While Passage Global Capital Management, LLC believes the information to be accurate and reliable, we do not claim or have responsibility for its completeness, accuracy, or reliability. Statements of future expectations, estimates, projections, and other forward-looking statements are based on available information and Passage Global Capital Management, LLC’s views as of the time of these statements. Accordingly, such statements are inherently speculative as they are based on assumptions that may involve known and unknown risks and uncertainties. Actual results, performance or events may differ materially from those expressed or implied in such statements.

Categories
Uncategorized

The Recession Question

The United States entered into a technical recession with the second quarter showing negative growth in real GDP for two consecutive quarters. However, the word “technical” is key. Official recessions are declared by the National Bureau of Economic Research (NBER), which takes a more nuanced perspective. The NBER defines a recession as involving “a significant decline in economic activity that is spread across the economy and lasts more than a few months.” The NBER declares recessions retroactively, meaning that they wait for the data to support their conclusions and then determine whether the U.S. has been in a recession. Economic growth is only one component of a recession; the other major factor is much more relevant and visible to most people: the unemployment rate. Fortunately, unemployment is still low and provides no hint that the U.S. is currently in a recession. This, of course, does not say anything about the future direction of the economy. Unemployment is a lagging indicator (that is, it provides an indication of the previous economic state rather than a prediction of the future state). However, robust employment does indicate that the economy is still relatively healthy despite weak consumer sentiment and strong inflationary pressures.


Although many employers are having trouble finding workers, it is debatable whether the U.S. is in a wage-price spiral. This occurs when rising consumption costs spur workers to demand higher wages resulting in a stagflationary feedback loop. There is no doubt that both inflation and nominal wages are rising, but they are not rising at the same rate. While average hourly wages grew by 5.2% year-over-year in July on a nominal basis, real average hourly wages declined by 3% according to data from the Bureau of Labor Statistics.


This does not imply that a tight labor market and rising wages are irrelevant to inflation, but it does imply that there are other drivers making a greater impact on inflation; primarily supply-chain struggles and energy prices. In July, energy expenditures made up about 9% of CPI, with energy prices rising 32.9% from a year prior. The good news is that energy prices have started to decline over the short-term. Gasoline prices, for example, declined 7.7% from June to July. This led to a welcome slowdown in inflation with prices up in July only 8.5% year-over-year as compared to 9.1% for June. It will take more than one month to reign-in inflation, however, especially as core CPI, which excludes volatile food and energy costs, barely budged in July compared to a month prior (albeit after declining more quickly from March to June than the all items CPI). The Fed will likely have to continue being aggressive in order to maintain credibility in its ability and willingness to fight inflation.

The tight labor market gives the Fed some room to maneuver and still maintain the hope of a soft landing, at least for now. Focusing all attention on the labor market would indicate that the U.S. is not even close to a recession at the moment. One relevant indicator to examine is the Sahm Rule, created by economist Claudia Sahm, which signals a recession as soon as the three-month moving average of the unemployment rate rises by 0.5% relative to its 12-month low. This is meant to be a real-time signal of recession rather than a retroactive declaration, as with the NBER. As one would expect, this is currently well below the 0.5% threshold that would signal recession.


As previously mentioned, unemployment is a lagging indicator, and does not give a strong signal about the future health of the economy. To try to predict future economic conditions, one may do better to focus on leading indicators. One of the best leading indicators is the stock market. This is unfortunate for investors who may try to use recessions as a trading signal. Often by the time the economy is in a recession, much of the damage in stocks has already been done. The S&P 500 Index entered bear market territory earlier this year but has recovered some of the loss. Whether the market is in a true recovery or “bear market rally” remains to be seen, but the heightened volatility does suggest that some investors are wary of an economic downturn. Further evidence of recession fears comes from the U.S. Treasury yield curve. This classic recession indicator is said to forebode recession when it is inverted, or long-term Treasury yields fall below short-term yields as investors price in the anticipation of rate hikes from the Fed (short-term rates are more sensitive to changes in the Federal Funds Rate than long-term rates are[1]). The yield curve is in the process of flattening and has already inverted when comparing the long-term 10-year yield vs. the short-term 2-year yield. Some argue that a better indicator is the spread between the 10-year and 3-month yield, which has not yet inverted, but has been on the verge of inversion since late July. There are other leading indicators as well, which are often combined together into a single index to provide a better signal; but, of course, none of these indicators are perfect predictors.


There is still work to do before the Fed turns dovish again, and investors should not expect a technical recession by way of declining GDP growth to turn the Fed’s attention away from inflation. Many blame the Fed, at least partially, for high inflation due to the vast amount of monetary stimulus injected into the economy in response to the covid-19 pandemic. During the pandemic, the Fed made clear that their priority was very understandably lowering unemployment. As the pandemic dragged on into 2021 and unemployment began to fall while inflation started to creep up, the Fed still was focused on unemployment while dismissing inflation as transitory. Then, inflation started to dominate the headlines and the Fed switched gears into inflation-fighting mode. The Fed has been somewhat fortunate in that it has been able to focus most of its energies at one time on either unemployment or inflation; not both. Although the Fed must bring inflation down, Jerome Powell and company must be careful not to lose total sight of the labor market. As rates continue to rise, the Fed’s already difficult task could become more difficult. The Fed will have to walk a tightrope: a wrong step in one direction and inflation will continue to entrench itself in the economy; a wrong step in the other, and workers could begin to lose jobs at a higher rate. If the latter happens, the U.S. could experience a real recession. But that has not happened yet, and there is still a possibility that the Fed can walk the tightrope to the other side without stumbling.


[1] Note that this refers specifically to yields rather than prices. Bond prices are more sensitive to interest rate changes at the long end of the curve.


The views expressed represent the opinion of Passage Global Capital Management, LLC. The views are subject to change and are not intended as a forecast or guarantee of future results. This material is for informational purposes only. It does not constitute as investment advice and is not intended as an endorsement of any specific investment. Stated information is derived from proprietary and nonproprietary sources that have not been independently verified for accuracy or completeness. While Passage Global Capital Management, LLC believes the information to be accurate and reliable, we do not claim or have responsibility for its completeness, accuracy, or reliability. Statements of future expectations, estimates, projections, and other forward-looking statements are based on available information and Passage Global Capital Management, LLC’s views as of the time of these statements. Accordingly, such statements are inherently speculative as they are based on assumption that may involve known and unknown risks and uncertainties. Actual results, performance or events may differ materially from those expressed or implied in such statements.

Categories
Uncategorized

Increasing Interest Rate Impact

The majority of investors are well-informed of the headwinds facing financial markets, primarily elevated inflation in combination with tightening monetary conditions. Most have felt a damaging impact on their investments, especially since many of the successful strategies utilized in bull markets are now ineffective. Younger investors have never experienced such a substantial rising rate environment. On May 4th, the Fed implemented a half-percentage-point rate increase, which is the largest since 2000, and they are doing so at the fastest pace in over three decades. If they continue down this direction with additional half-point increases, rather than the typical quarter-point increase, this would be the most aggressive pace for policy-tightening since the 1980s. Many criticize the Fed for believing that inflation was transitory and for having a delayed response in combatting it. The most well-known tool in the Fed’s arsenal to fight inflation is interest rates. The short-term interest rate, also known as the Fed Funds rate, is directly controlled by the Federal Reserve. When the Fed raises this rate, it becomes more expensive to borrow money, which results in less investment and consumer spending. The current inflationary environment is a result of aggregate demand exceeding supply, so by raising interest rates, the Fed is attempting to push down this demand to stabilize prices. However, it is of course not that simple. Price stability is only one half of the Fed’s dual mandate; the other half is to promote maximum sustainable employment. If the Fed does not handle the rate hikes correctly, the economy could slow down much too quickly. Workers could lose their jobs, and the unemployment rate may increase; it could possibly even result in a recession. Therefore, it is important to be informed on current investor sentiment and involvement in the market as well as how certain investments have historically performed in rising rate environments.

Recently, there was an inflow of investors in the market who have jumped in on “buying the dip.” Many investments that performed very well before this year’s selloff, such as the ARK Innovation ETF from Cathie Wood, have now plummeted. Despite this, investors have remained resilient and asset flows indicate that the general strategy of investors during this interest rate-hike environment is drastically different than it has been in the past. Historically, when the S&P500 has suffered such a decline like what is happening now, investors sold nearly $10 billion in the first twelve weeks after the market peak. Now, on the contrary, investors recently invested an additional $114 billion as the S&P500 was dropping into bear market territory. This March, a record for the largest monthly sum was reached when there was an inflow of $28 billion in exchange traded funds and U.S. stocks. Following that, investors hit a one-day record when they invested about $2.6 billion in the same asset classes.1 There is an evident shift in investor sentiment compared to the past, and a reason for this relates to the financial crisis of 2008.

Unfortunately, investors that sold out of panic in the crisis later regretted their decision. Not only did they lock in their losses, but afterwards, there was an extended bull market where the S&P500 soared nearly 400%. This experience has left modern-day investors more optimistic in holding onto their assets for the long-term. Although they are confident, some investors’ positivity is beginning to deteriorate. The current selloff is becoming prolonged compared to the most recent bear market in 2020, which only existed for roughly 23 trading days. Many individuals who “bought the dip” this time continue to suffer losses. It is impossible to know how far the dip will go, and this leaves investors who have cash on the sidelines with the complex decision of when to wade into the market.

It is important to know how certain asset classes have performed in the past when interest rates were on the rise (keeping in mind that past results are not a guarantee of the future). Additionally, there is no rulebook detailing what to do when interest rates rise, and there is not a single strategy that will work for every investor. If you have created a sound financial plan you are comfortable with for the long-haul, then you should stick with it and may need to only make minor changes to weather the current storm. Generally, when interest rates rise, fixed income investments will decline in value; a common principle is that bond prices and interest rates tend to move in opposite directions. Bonds’ sensitivity to interest rate changes is measured by duration. A higher duration implies higher interest rate risk. For example, longer-maturity bonds will be more sensitive to movements in interest rates compared to shorter-maturity bonds, all else equal. If a fixed income strategy has a shorter duration, then it has less exposure to rising rates. In regard to Treasury bonds, many consider these to be a safe-haven due to their lack of default risk, which is the risk that the borrower will be unable to make the required payments on principal and interest to the lender. Aside from interest rate risk, the other primary risk to Treasury bonds is inflation. Higher inflation erodes purchasing power and therefore makes fixed coupon and principal payments less valuable to the bond owner. Corporate bonds have these risks as well but are considered riskier than Treasury bonds since they also have default risk. Unintuitively, however, corporate bonds have typically performed better during times of interest rate increases compared to Treasury bonds. This is due to credit spreads. Credit spreads are the differences in yields between corporate and Treasury bonds. Credit spreads measure how much extra return an investor requires for accepting default risk. When credit spreads shrink, corporate bonds benefit because investors are more willing to take on default risk. Generally, the economy is still strong when the Fed raises rates, and credit spreads typically narrow when the economy is strong. Hence, corporate bonds have performed better in these times historically.

There are alternative fixed-income options to traditional, fixed-coupon bonds as well. For example, interest rate hedged bond ETFs aim to eliminate any form of interest rate risk by incorporating hedges specifically targeted at rising rates. However, these limit profit opportunity when rates fall. Floating rate investment grade bonds also have very little exposure to movements in rates, so a substantial portion of interest rate risk is eliminated during rising rate environments. TIPS, or Treasury Inflation Protected Securities, have been in the spotlight recently due to current inflation levels. One caveat is that these are meant to hedge against inflation expectations, not against realized inflation, and they do not protect against changes in real interest rates. However, TIPS outperformed Treasuries when the Fed increased rates in the past.2

Investors should not pick one asset class for their portfolio. Rather, they should take a multi-asset approach. Shifting away from fixed-income strategies, equities do not necessarily always struggle in times of rising interest rates. Historically, when rates rise, the financial, industrials, materials, and energy sectors have been top performers.2 Value stocks can also perform well compared to growth stocks in rising rate environments. The former is composed of companies with stock prices near or below the intrinsic value of the business whereas the latter relies on estimates of future cash flows to derive value. However, as interest rates rise, future cash flows become less valuable in present value terms, so investors have more appetite for current, stable cash flows like those found in value stocks.

Of course, every rate hiking cycle is different, and asset classes that outperform in one environment may not continue to do so in the future. Each investment has its own specific risks, and there are other factors to consider in every decision rather than just rising rates. Speak with Passage Global Capital Management to learn about the risks of investing in a rising interest rate environment and how they can be properly managed.


1Banerji, Gunjan and McCabe, Caitlin. Buy the Dip Believers Are Tested by Market’s Downward Slide.” Wall Street Journal. May 10, 2022.

2 ”A Playbook for Rising Interest Rates.” ProShares. 2022.


The views expressed represent the opinion of Passage Global Capital Management, LLC. The views are subject to change and are not intended as a forecast or guarantee of future results. This material is for informational purposes only. It does not constitute as investment advice and is not intended as an endorsement of any specific investment. Stated information is derived from proprietary and nonproprietary sources that have not been independently verified for accuracy or completeness. While Passage Global Capital Management, LLC believes the information to be accurate and reliable, we do not claim or have responsibility for its completeness, accuracy, or reliability. Statements of future expectations, estimates, projections, and other forward-looking statements are based on available information and Passage Global Capital Management, LLC’s views as of the time of these statements. Accordingly, such statements are inherently speculative as they are based on assumption that may involve known and unknown risks and uncertainties. Actual results, performance or events may differ materially from those expressed or implied in such statements.


Categories
Uncategorized

Market Corrections are Inevitable; Panic Selling Shouldn’t Be

Investors can quickly become panicked when they see the stock market experiencing a market correction, or even more daunting, entering bear market territory. The market recently experienced a correction, but these events are more common than one may think. Although the past is no guarantee of the future, over the last century, the market has recovered from drawdowns and provided higher gains for long-term investors. Market corrections are inevitable, and they are bound to happen multiple times during every investor’s life. It is easy to become negatively influenced and anxious during times of market turmoil, but rather than acting out of fear, learning the facts about similar events will provide you with a more encouraging mindset. Experienced investors are more likely to be well-informed on volatility and past market behaviors, so they are able to stay committed to their investment strategy. Having this beneficial knowledge will allow you to look past the discomfort more easily to avoid the urge to respond in a costly manner that you may later regret.

A major stock index, such as the S&P 500 or the DJIA, experiences a market correction when it falls more than 10%, but less than 20%, from a recent peak. When the decline exceeds 20%, the index enters bear market territory, which involves a higher degree of detrimental impact compared to a market correction. Market corrections are generally caused by current factors that disrupt the markets; these factors are typically temporary and quickly fade. On the contrary, bear markets are more likely to be the result of substantial imbalances that have built up over the years. These may coincide with recessions, defined as at least two consecutive quarters of decline in Gross Domestic Product (GDP), which is a measure of general economic health. Fortunately, bull markets generally last longer than bear markets and corrections. The average bull market lasts 8.9 years, whereas the average bear market lasts 1.4 years. Market corrections can be viewed as short-lived market setbacks that occur over a few months, and they are called “corrections” because the markets historically “correct” themselves where prices return to their longer-term trend. Market corrections are undeniably going to continue and affect most investors’ lives at some point. Many may find this frightening, but actually in a lot of cases, market corrections have acted as a healthy reset for investor expectations and stock valuations.

Overall, predicting stock market behavior is beyond difficult, and if incorrect, an investor may experience tremendous opportunity cost. Educated investors know that time in the market beats trying to time the market. To corroborate this point, a research study1 from J.P. Morgan found that “investors who missed the top 10 trading days during a recent 20-year stretch would have seen their returns fall by almost half, compared to those who stayed invested the whole time.” It is accurate to conclude that market corrections may damage short-term investors, but for long-term investors, they often provide buying opportunities. Times as this cause discomfort, but it is normal. Investors have to “pay to play”, and sometimes that means going through short-term discomfort to experience long-term success.

Financial markets kicked off 2022 with turmoil, where the economy is encountering a rise in geopolitical tensions, a four-decade high inflation rate, COVID-19 impacts, and interest rate hikes from the Fed – to name a few headwinds. The last factor is critical. The majority of market corrections happen during rate hiking cycles. Of course, the dynamic between the Fed Funds rate, economy, and stock market is complicated and may be different across cycles. So far this year, all three major stock market indexes, the S&P 500, the Dow Jones Industrial Average, and the tech-heavy NASDAQ, suffered corrections with the latter entering bear-market territory. However, the discomfort of market underperformance today may be softened for the average investor due to a tight labor market and strong consumer balance sheets. Additionally, market performance is ultimately driven by fundamentals such as corporate revenue and earnings. For 2022, investors will continue to stay up to date on a variety of risk factors including the Fed monetary policy, consumer spending, COVID-19, and the Russia-Ukraine crisis, but the most alarming of all is the persistently high inflation rate. Although markets do move faster than they have in the past, we can analyze past market corrections to get a better understanding of how the market may behave in the future.

Since 1950, there have been approximately 39 market corrections.2 The stock market does not follow the pattern of averages, but to put it in perspective, that is equivalent to a double-digit decline occurring in the S&P about every 1.85 years. On average, a stock market correction will take 6 months to reach its trough. 7 of those corrections took more than a year to reach its bottom, and 24 of them took approximately 3.5 months. Additionally, 6 of these 39 corrections occurred in the 2010’s. However, over the 2010 decade, the S&P 500 received a total return of about 256%; this alone proves how the market rebounded and rewarded investors who stuck it out with outstanding gains. Another example is 2018, when the S&P 500 plummeted more than 10% in the first and fourth quarter. This was abruptly followed by a rebound of over 13% in the first quarter of 2019. In the bear market between 2007 and 2009, the S&P 500 declined over 48%. On a brighter note, the S&P 500 was up 68.6% from the low point one year later and up a total of 95.4% 2 years later. Market corrections are actually extremely common. When looking at 2002 through 2021, there has been a decline of more than 10% in 10 of those 20 years – or 50% of the time. In 2 other years in that timeline, the decline was very close to 10%. Even though the markets experienced these deep falls from 2002 to 2021, they rose and provided positive returns in all but 3 years. A report from Crestmont Research3 looked into the years of 1919 to 2021 to analyze the rolling 20-year average annual total returns. The results are optimistic, as it was found that the “S&P 500 always made money for investors on a total-return basis if they held for at least 20 years”. Out of all these years, only 2 of them ended with an average annual total return of less than 5%, and more than 40 of those years ended between 10.8% and 17.1%. Furthermore, we can examine how the market tends to perform after exiting the market correction. Using data beginning in 1928, the S&P 500 had an average gain of nearly 14% one year after a market correction. One of the quickest and deepest corrections was during COVID-19, but this was also one of the speediest recoveries. In the span of a few weeks, the S&P 500 lost 30%, but it then regained all of that loss within 5 months. Within one year following the bottom of this correction, the value of the S&P 500 doubled. This example, as well as all the others, prove that market corrections are common, and that investors should avoid attempting to “fix” the correction. As mentioned, panic moves will lock in your losses and you will lose out on the future gains from recovery. Investors can benefit from understanding these historical tendencies. The market has volatility and times such as this are normal, so it is important for long-term investors to remain confident in their investment strategy.


1 Azzarello, Samantha and Roy, Katherine. “Impact of being out of the market.” J.P. Morgan Asset Management, 5 June 2020.

2 Williams, Sean. “How Long Do Stock Market Corrections Last?” The Motley Fool, 20 March 2022.

3 “Returns Over 20-Year Periods Vary Significantly; Affected by the Starting P/E Ratio.” Crestmont Research. 2022.


The views expressed represent the opinion of Passage Global Capital Management, LLC. The views are subject to change and are not intended as a forecast or guarantee of future results. This material is for informational purposes only. It does not constitute as investment advice and is not intended as an endorsement of any specific investment. Stated information is derived from proprietary and nonproprietary sources that have not been independently verified for accuracy or completeness. While Passage Global Capital Management, LLC believes the information to be accurate and reliable, we do not claim or have responsibility for its completeness, accuracy, or reliability. Statements of future expectations, estimates, projections, and other forward-looking statements are based on available information and Passage Global Capital Management, LLC’s views as of the time of these statements. Accordingly, such statements are inherently speculative as they are based on assumption that may involve known and unknown risks and uncertainties. Actual results, performance or events may differ materially from those expressed or implied in such statements.

Categories
Uncategorized

Rising Rates and Risk Measurements

Inflation has reached a 40-year high with consumer prices and wages reaching excessive levels, competing in a wage-price spiral. With inflation running well above the 2% target, 2022 will consist of the Federal Reserve fighting for their credibility. It is anticipated that the Fed will raise interest rates at consecutive policy meetings for the first time since 2006, and a half-percentage-point increase, which has not been done since 2000, has not been fully ruled out. Some investors are fearful that Fed Chairman Jerome Powell will lead the economy into a recession in the effort to quell inflation. The Fed hasn’t had to combat inflation of this magnitude since the 1980’s, and historically when inflation has been this high, the Fed has not been able to push it down without a subsequent recession. Even with the Fed’s efforts, inflation may remain high due to factors outside of the Fed’s control, such as worsened shipping delays and supply chain issues from the pandemic. As an investor, it is critical to have an experienced portfolio manager guiding your investments. Portfolio managers must implement risk management techniques to evaluate the potential impact that these negative events can have on your portfolio, and to ensure that you are not exceeding your desired risk tolerance. Risk measurements and models, including VaR, modified versions of VaR, scenario analysis, and stress testing can provide insights focused on these concerns.

Skillful portfolio managers may utilize risk models in combination with their judgement to exploit the strengths and limitations of your portfolio. VaR, or value at risk, is the minimum loss of portfolio value that would be expected to occur a specific percentage of the time over a certain period of time. This is easier to understand with an example. A 5% daily VaR of $1,000 would mean that on 5% of days, a portfolio is expected to lose at least $1,000.  Portfolio managers have the flexibility to choose the best  percentage threshold and time horizon (e.g., daily, monthly, yearly, etc.) to meet their requirements.

An effective portfolio manager must understand the advantages of VaR, but also its limitations. VaR is a simple, yet valuable risk measure that allows one to see the potential losses that can danger a portfolio. There is a substantial amount of information shown in a single number. This number can provide a basis for risk comparison across asset classes and portfolios to see where the majority of risk is emanated from. This allows a portfolio manager to see adjustments they may need to make to realign its VaR, or they may realize that a reallocation of the portfolio is necessary. Although useful, VaR does require discretionary choices, such as choosing the data sources. There also may be more extreme, “left-tail events” that occur which VaR may not capture. VaR also has difficulty taking illiquid assets into account and is often understated for these assets. It is also important to understand that VaR does not portray the worst-case scenario and that losses can exceed it. It is also sensitive to correlation risk. Correlation risk is the risk that when markets are under extreme stress, correlations among assets tend to rise which can significantly decrease diversification benefits in a portfolio. VaR can be oversimplified, and these limitations are not unique to this specific risk measure. However, if a portfolio manager fully understands this, they can still receive valuable information. Rather than using VaR by itself, risk management is most effective with a combination of risk measurements and models.

A portfolio manager cannot obtain all the necessary information through one single risk measure; there are numerous variations of VaR that aim to provide additional information where VaR lacks. CVaR, also referred to as conditional VaR, expected tail loss, or expected shortfall, represents the average loss that would occur in the left tail of the distribution whereas traditional VaR only represents the minimum loss. For example, consider the aforementioned portfolio with a 5% VaR of $1,000. The CVaR of this portfolio will be more than $1,000. VaR represents the minimum loss on the worst 5% of days whereas CVaR represents the average loss on those same days. CVaR can be more useful to a portfolio manager than VaR since it captures more information about the extreme left tail of the distribution. IVaR, or incremental VaR, determines how the VaR will change if a certain position size in the portfolio is altered relative to the other positions or if a position is added or removed. If a portfolio manager wants to increase a holding in the portfolio, they would recalculate the VaR under the assumption that this change has been made. The IVaR is calculated by finding the difference between the before VaR and the after VaR, which reflects how VaR is affected due to this certain change. A portfolio manager can compare the new VaR, whether it is higher or lower, and make any changes they see as beneficial for the portfolio. MVaR, or marginal VaR, can be used to determine how each asset contributes to the VaR; it measures the change in VaR when a very small alteration is made in a portfolio position. Although IVaR and MVaR are both risk measurements that determine the impact of an anticipated change, MVaR is more focused on smaller changes within the portfolio. The last variation of VaR is the ex-ante tracking error, also known as relative VaR. The ex-ante tracking error delineates the degree to which the performance of a portfolio may deviate from its benchmark. Although VaR and its variations support the risk management process, a portfolio manager must also understand the factors that are driving the risk.

Scenario analysis and stress testing can allow portfolio managers to analyze the risk drivers and address the shortcomings of other probabilistic risk measures. A scenario analysis can look at any event and evaluate how a portfolio may perform under these conditions. This risk model has two different methods: historical and hypothetical. A historical scenario analysis looks at what the return on a portfolio would be if a repeat of an event in history, such as The Great Inflation, were to occur. To determine this return, the value of each portfolio position is calculated before and after the changes to see the effect. This analysis can be run over a timeline to include different actions the portfolio manager may make throughout this event to alleviate the potential repercussions. Alternately, a stress test allows the portfolio manager to change multiple variables at once. This allows a portfolio manager to apply extreme, negative stress to a portfolio and assess the impact. This is a productive way to reflect on the impact that certain adverse market movements may have on a portfolio. However, it is unlikely that a historical event would happen in the exact way that it once did. The solution to this is a hypothetical scenario analysis, where one can evaluate the impact of an event that has not previously occurred on an investment portfolio. To construct a reliable hypothetical scenario, one must complete a reverse stress test, which involves targeting exposures to determine how they behave in different environments. Scenario analysis and stress testing provide an opportunity to review the potential impact from events and to understand the risk exposures. There is no certainty to how the markets will behave, and hypothetical scenario analysis, in combination with the other risk measurements, can provide a portfolio manager with a framework to best prepare for varying market conditions.


The views expressed represent the opinion of Passage Global Capital Management, LLC. The views are subject to change and are not intended as a forecast or guarantee of future results. This material is for informational purposes only. It does not constitute as investment advice and is not intended as an endorsement of any specific investment. Stated information is derived from proprietary and nonproprietary sources that have not been independently verified for accuracy or completeness. While Passage Global Capital Management, LLC believes the information to be accurate and reliable, we do not claim or have responsibility for its completeness, accuracy, or reliability. Statements of future expectations, estimates, projections, and other forward-looking statements are based on available information and Passage Global Capital Management, LLC’s views as of the time of these statements. Accordingly, such statements are inherently speculative as they are based on assumption that may involve known and unknown risks and uncertainties. Actual results, performance or events may differ materially from those expressed or implied in such statements.

Categories
Uncategorized

Anxiety Over Inflation

One of the main concerns investors have as the world begins to emerge from the Covid-19 era is inflation. Inflation is daunting to investors because it results in a loss of their purchasing power, and it is more difficult for their investments to produce real returns above inflation. Prices have increased 6.2% since October 2020, as measured by the Consumer Price Index (CPI), marking a 30-year high. This has worried economists that we will enter a period of stagflation, which is weak economic growth combined with high inflation. Although the Federal Reserve believes inflation will settle down next year, investors should still be aware of the current and historical events surrounding inflation spikes, along with investments that have historically worked as a hedge for inflation.

A primary event that has contributed to this inflation spike is the reopening of the economy from the Covid-19 pandemic. Pandemics have historically caused a disruption between the balance of supply and demand. Typically, a pandemic would cause demand to fall due to more people being infected by a disease, which results in them consuming less. However, with the Covid-19 pandemic, policymakers distributed a substantial amount of stimulus. With the reopening of the economy, the stimulus has resulted in an increase of demand. The combination of the current supply shortage and high demand leads to higher prices, hence the sharp increase in the inflation rate. No one can be certain about how long these implications from Covid-19 will linger around the economic and political sphere. Additionally, generational attitudes are formed through shared events such as wars, recessions, and pandemics. All of the effects from a major event can often take years to appear, which means we have not yet seen all of the social changes that will occur due to Covid-19. As the newer generations begin to grow older and gain more positions of influence, we could begin to see a difference in societal and economic behavior.

Another current event affecting the high inflation rate is the supply-chain shortage accompanied with the labor shortage. The supply-chain shortage is pervasive in multiple sectors of the economy and according to Moody’s Analytics, it “will get worse before it gets better.” The computer chip shortage has resulted in a lack of new cars, which in turn, has substantially raised the price of new cars. In fact, this shortage has effected the auto industry so drastically that AlixPartners forecasts the opportunity cost of lost sales to reach $210 billion for the year. This led General Motors to shut down their production for a short time period in September. Car dealerships have very limited inventory on their lots, which makes right now a very expensive time to purchase a vehicle. Other supply shortages are occurring in the housing market and in retail stores such as grocery markets. Many shelves have appeared empty and there is likely no way to improve these conditions before the holiday season, resulting in many shoppers to rush to the stores to begin their holiday shopping early this year. Major contributing factors to the shortages include the effects of Covid-19, a dearth of workers, and port congestion. Examples can be found in a variety of industries. Covid-19 cases have recently experienced a considerable jump in countries such as Vietnam. Vietnam produces half of the apparel for brands including Nike and Adidas, resulting in supply shortages for the United States. The lack of labor is significantly prevalent in the trucking industry which has caused shipping prices to skyrocket and shipping ports to become badly congested. Many ports have shut down, in some cases due to workers becoming infected with Covid-19. When ports shut down, this causes the open terminals to become flooded. These are only some of the current events that are causing inflation to rise and instilling fear in consumers.

More threats posing a risk to the economy are rising bond yields, potential interest rate hikes, and soaring energy costs. Investors worry about a rise in bond yields because it can trigger a fall in stock prices. We recently experienced the 10-year Treasury yield rising above 1.5% and the 30-year yield rising above 2%. This resulted in growth stocks and Big Tech stocks suffering the most. When there are higher bond yields, it decreases the value of future cash flows which in turn decreases stock valuations, especially for companies with anticipated growth as a major component of their stock prices. We can also expect to see a rise in interest rates at some point between 2022 and 2023. The Fed does this to make money more expensive to borrow in hopes this will slow down the pace of price increases. Natural gas and crude oil prices have risen to a 7-year high, heating oil prices rose 68% this year, and coal prices have drastically increased. High energy prices can increase inflation and cause consumers to not spend money on other products or services. This slows down the U.S. recovery pace and weakens economic growth. The mix of high inflation and slowed economic growth is known as stagflation, a term used to describe the economic standpoint of America in the 1970’s. Although unlikely, many are wondering if we are entering a period similar to the 70’s. The Great Inflation, an event lasting from 1965 to 1982, was a period where the cost of living for Americans soared. Prices for everyday items such as food saw inflation of 15% and the unemployment rate almost reached 10%. Consumers congregated in the streets and protested against these rising prices and for an increase in their wages. Wages eventually went up, but then companies instantly increased their prices even more, almost like a never-ending game of tag. This crisis began to dissipate after then-Fed Chair Paul Volcker raised interest rates to an astronomical 20% and launched a bull market for both stocks and bonds. Although there are similarities to what is happening in the economy now, the Fed believes that this high inflation is temporary, and we do not need to worry about another Great Inflation event happening anytime soon.

In order to protect purchasing power, investors should ultimately be aware of assets that have historically performed well as a hedge against inflation. It is important to note that these assets may not offer the same protection in the future and they have other risk factors which may not make them appropriate for everyone. First and foremost, stocks can be an effective inflation hedge. Specifically, stocks in companies that are able to pass on costs to their customers and maintain, or even expand, their margins tend to be well-positioned for inflation. Additionally, stocks that are not overly-reliant on future growth may be best due to the valuation reasons explained earlier. Real estate has also been a good historical inflation hedge. Investors can invest in real estate directly or indirectly through an investment vehicle such as a publicly-traded Real Estate Investment Trust (REIT). An MIT study in 2017 proved that the income from retail property is a better hedge for inflation compared to residential, office, and industrial property. Fixed-income, cash, and cash equivalents often suffer the most with inflation. However, Treasury Inflation-Protected Securities (TIPS) are designed specifically to protect against inflation. The interest on TIPS will never change, but the par value will rise with CPI. At maturity, the investor will be paid the higher value between either the original or adjusted principal. Commodities, including gold, other precious metals, coffee, and oil have also historically worked as a hedge against inflation. An investor can involve themselves with commodities through ETFs, purchase them physically, buy futures, or invest in mining companies. Although inflation is often beneficial for commodities, these are extremely risky and are tied to government regulations and other events. Cryptocurrency is a more speculative investment which proponents argue can serve to protect against inflation in fiat currencies. Bitcoin, for example, has a built-in inflation hedging mechanism due to the finite number of coins that can be mined. However, there is not a long track record to prove it’s effectiveness. Ultimately, investors should diversify their holdings within their portfolio and know how much risk they are willing to take to protect themselves against rising inflation.


The views expressed represent the opinion of Passage Global Capital Management, LLC. The views are subject to change and are not intended as a forecast or guarantee of future results. This material is for informational purposes only. It does not constitute as investment advice and is not intended as an endorsement of any specific investment. Stated information is derived from proprietary and nonproprietary sources that have not been independently verified for accuracy or completeness. While Passage Global Capital Management, LLC believes the information to be accurate and reliable, we do not claim or have responsibility for its completeness, accuracy, or reliability. Statements of future expectations, estimates, projections, and other forward-looking statements are based on available information and Passage Global Capital Management, LLC’s views as of the time of these statements. Accordingly, such statements are inherently speculative as they are based on assumption that may involve known and unknown risks and uncertainties. Actual results, performance or events may differ materially from those expressed or implied in such statements.

Categories
Uncategorized

Infecting the Economy

The “R naught” (pronunciation of the term R0) is not an often-heard vocabulary word unless you saw the 2011 American medical thriller movie “Contagion” about a worldwide pandemic of a new virus. It is also often encountered in the epidemiology as well as public health literature, and it is a crucial part of public health planning during an epidemic like the current coronavirus (Covid-19) outbreak spreading widely in China and around the world. The basic reproduction number (R0), also called the basic reproduction ratio, is an epidemiologic metric that was first formulated in the 1970s by the German mathematician Klaus Dietz. It is used to represent the average number of people that an infectious individual will infect in a specific population. The potential size of an outbreak or epidemic often is based on the magnitude of the R0 value for that event. In the early stages of an outbreak, R0 is estimated to be around two, which suggests a single infection will, on average, become two, then four, then eight and so on. This can be seen from past outbreaks such as pandemic flu as well as Ebola and now with coronavirus.

Considering that there have been nearly 80,000 confirmed cases of the coronavirus in China and more than 7,000 cases in 58 other countries, including 62 infections in the U.S., according to the World Health Organization, the potential risk of a global pandemic in the coming year should not be underestimated. Adding to the uncertainty, development of a successful vaccine is taking longer than expected and quarantines and other interventions are not effectively working to contain transmissions.

There are also economic consequences and financial risks given the fact that the Chinese economy is now more than four times larger than it was at the time of the 2003 SARS outbreak and it is considerably more vital as a source of demand and for its central role in many manufacturing supply chains. ANZ predicts Chinese growth in gross domestic product could fall to as low as 3.2% this quarter, half the rate of the first three months of 2019.

An expected slowdown in China also comes at a time when the eurozone economy is growing at the slowest rate in seven years. This is particularly true for Germany’s export-oriented economy. Deutsche Bank’s chief economist estimated that the coronavirus outbreak would knock 0.2 percentage points off first-quarter growth for Germany, making a technical recession quite probable after zero growth in the fourth quarter.

Japan is also facing the prospects of a recession after a dreadful 6.3% decline in GDP for the fourth quarter of 2019. However, the coronavirus outbreak should only have a limited impact on U.S. growth, thanks largely to America’s booming consumer economy and a supportive Federal Reserve, which is closely monitoring the developments. “We know that there will be very likely some effects on the United States,” Jay Powell, U.S. Federal Reserve chairman, said during congressional testimony on February 11. “The question we’ll be asking is: Will these be persistent effects that could lead to a material reassessment of the outlook?” According to UBS, the most likely ways in which the virus could dampen U.S. growth are a decline in Chinese tourism and weaker demand for American exports. The worse the outbreak becomes, the longer it persists, and the heavier the impact on the global economy, the more likely it is that the Fed will ease policy again. However, if history is any guide, the coronavirus will eventually come under control, and global economies will get back on track to grow again.

The views expressed represent the opinion of Passage Global Capital Management, LLC. The views are subject to change and are not intended as a forecast or guarantee of future results. This material is for informational purposes only. It does not constitute as investment advice and is not intended as an endorsement of any specific investment. Stated information is derived from proprietary and nonproprietary sources that have not been independently verified for accuracy or completeness. While Passage Global Capital Management, LLC believes the information to be accurate and reliable, we do not claim or have responsibility for its completeness, accuracy, or reliability. Statements of future expectations, estimates, projections, and other forward-looking statements are based on available information and Passage Global Capital Management, LLC’s views as of the time of these statements. Accordingly, such statements are inherently speculative as they are based on assumption that may involve known and unknown risks and uncertainties. Actual results, performance or events may differ materially from those expressed or implied in such statements.

Categories
Uncategorized

Deal or No Deal

Don’t let the title of this month’s article trick you into thinking that we are going to write about the popular NBC game show that originally aired from 2005 to 2009, giving away millions of dollars to deserving contestants over the years. This is about the United Kingdom’s potential withdrawal from the European Union bloc and its economic cost amounting to billions of dollars over the years.

On July 29, Boris Johnson moved into his new address on 10 Downing Street as newly appointed Prime Minister of the United Kingdom, succeeding Theresa May as the new leader of the Conservative Party.

Mr. Johnson takes office at one of the most critical moments in Britain’s recent history, and the toughest challenge of his career is to negotiate improved divorce terms and conditions for Brexit with European Union leaders in Brussels. If they don’t agree, which has happened before, he pledges to leave the European Union without a Withdrawal Agreement (no-deal Brexit) by October 31, 2019. Whether he is planning to follow through with an abrupt exit or it is part of his negotiating strategy is unknown. Given the previous pledges and recent rhetoric of Mr. Johnson as well as the clock ticking down to the October deadline, the risk of “no-deal Brexit” increasingly starts to look like a real possibility.

Such a critical decision would produce both financial and political consequences. It would most likely shake up the British economy and could even cause it to plunge into a recession, which would not be welcomed by the global financial markets.

Heightened investor fears are already being reflected in some corners of the financial markets. The British pound, like the proverbial canary in the coal mine, which refers to early warnings of problems, has slumped to its weakest level against the US Dollar in more than 34 years. The currency fell to as low as $1.2091 recently. Some analysts predict it will continue to grind steadily lower toward the October deadline.

There is also the possibility of a political fallout from an abrupt Brexit for the United Kingdom, which could render toxic feelings among its four countries, especially between England and Northern Ireland as well as Scotland which could eventually harm their relationships and damage the bonds that hold them together in the Union.


A disorderly Brexit would also have an economic cost on the U.S. economy albeit a relatively minimal one given that U.S. exports to the UK only account for 0.7% of U.S. GDP. However, negative sentiment could take a greater toll on the U.S. financial markets due to its contagion effect.

All these potential consequences are mostly dependent on the worst-case scenario – no-deal Brexit – which involves a complex process complicated by the fact that conservatives hold a tiny majority, are blocked by a divided parliament, and are confronted with a split country. Therefore, the outcome is uncertain and highly unpredictable even for the most sophisticated statistical models.

Fortunately, an odd phenomenon called the wisdom of crowds may help shed some light upon the chances of a no-deal Brexit. The term was popularized by New Yorker business columnist James Surowiecki, who postulated that a crowd’s “collective intelligence” will generate better outcomes than a small group of experts, even if members of the crowd don’t know all the facts. It produces better results, especially with complex problems and uncertain outcomes like the Brexit deal. A technique called prediction market leverages the wisdom of crowds approach by polling a diverse crowd and aggregating their opinions to form a forecast of an eventual outcome.

With this in mind, we looked at a betting website which aggregates multiple betting exchanges in the UK. We analyzed the current odds placed by gamblers and calculated the implied probabilities on various Brexit outcomes, particularly deal or no deal.

Based on our results, the no-deal Brexit outcome currently has the highest odds of 11 to 5 giving an implied probability of 31.25% compared with the deal outcome.


In order to gain further insight and verify our previous findings about the two outcomes, we also looked at results of the recent July survey conducted by a market research and consulting company in the UK. The results support our previous research. The public (45%) thinks that the UK should go ahead with Brexit on October 31st even if it means leaving with no deal.

It will be interesting to see how much these results will vary as we get closer to the October deadline. Even though it is a rather daunting task to forecast such complex and uncertain outcomes, it still behooves us to try given that the stakes are high, especially when the deadline coincides with the October stock market phenomenon.

The views expressed represent the opinion of Passage Global Capital Management, LLC. The views are subject to change and are not intended as a forecast or guarantee of future results. This material is for informational purposes only. It does not constitute as investment advice and is not intended as an endorsement of any specific investment. Stated information is derived from proprietary and nonproprietary sources that have not been independently verified for accuracy or completeness. While Passage Global Capital Management, LLC believes the information to be accurate and reliable, we do not claim or have responsibility for its completeness, accuracy, or reliability. Statements of future expectations, estimates, projections, and other forward-looking statements are based on available information and Passage Global Capital Management, LLC’s views as of the time of these statements. Accordingly, such statements are inherently speculative as they are based on assumption that may involve known and unknown risks and uncertainties. Actual results, performance or events may differ materially from those expressed or implied in such statements.

Categories
Uncategorized

Picking up the Slack

The pace of U.S. economic growth remained robust at 3.1% in the first quarter of the year. The economy has continued to grow for 120 months in a row as of the end of June, matching the longest economic expansion in American history from March 1991 to March 2001 according to the National Bureau of Economic Research. With the Fed as the largest benefactor, stock market investors have enjoyed the unprecedented rally from the depths of the financial crisis lows to new, record highs fueled by long periods of historically low interest rates.

Amidst the 10th anniversary of the expansion, market participants wonder how much longer there is to go before the inevitable relapse into the next recession. To the frustrations of long-time market bears, expansions don’t simply die of old age. However, developments over the past several months suggest the economy may be starting to lose momentum. The following are some important statistical clues in consumer spending and labor-market data:

A Downward revision to consumer spending Consumer spending, which makes up more than two-thirds of U.S. economic output, grew at a 0.9% annual rate in the first quarter, compared with a prior estimate of 1.3% – a sharp slowdown from the fourth quarter, when consumer spending increased at a 2.5% rate.

Declining wage growth In a stable full-employment economy, wages should continue to rise consistently with improvements in productivity. Adding inflation over the past 12 months of 0.8% and average productivity growth of 1 .5%, nominal wages would be expected to grow by 3.3%. However, wages grew only 3.1% over the past 12 months, down from a 12- month high of 3.4% (see: Exhibit I).

Source: U.S. Bureau of Labor Statistics, Average Hourly Earnings of All Employees: Total Private [CES0500000003], retrieved from FRED, Federal Reserve Bank of St. Louis.
Exhibit I

A slowdown in job growth The U.S. is now at or very close to full employment as the unemployment rate dropped to 3.6%, the lowest since 1969. Given the employment rate leveling off at 60.6% (see: Exhibit II) and the working age population growing by about 156,000 a month, the U.S. economy needs to create about 94,500 jobs monthly (156,000 multiplied by 60.6%) to prevail in a full-employment economy. Yet, US Non-Farm payrolls indicated that only 75,000 new jobs were created in May. As can be seen from Exhibit III, the five-month average of Non-Farm payrolls has been steadily declining.


Exhibit II

Source: U.S. Bureau of Labor Statistics, All Employees: Total Nonfarm Payrolls [PAYEMS], retrieved from FRED, Federal Reserve Bank of St. Louis. Exhibit III
These economic indicators suggest that economic slack has almost been eliminated since the 2007-2009 recession. Stock market participants are closely watching this data as recessions are usually accompanied by declines in stock prices. Of the 12 recessions since WWII, the average corresponding drawdown in the S&P 500 index has been close to -29%. Since the beginning of 2018, the U.S. stock market has been displaying periods of increased volatility as investors become more wary of an impending recession.

Now, all eyes are on the Federal Reserve. Recently, the Fed signaled that it would start to lower interest rates if the economic climate doesn’t improve in the coming months. Up until late 2018, the Fed was determined to keep raising rates through all of 2019. This recent shift in the Fed’s policy stance underscores the conundrum that policy makers face: prolonging growth without overheating the economy and preventing the current full-employment situation from turning into the next recession.

The views expressed represent the opinion of Passage Global Capital Management, LLC. The views are subject to change and are not intended as a forecast or guarantee of future results. This material is for informational purposes only. It does not constitute as investment advice and is not intended as an endorsement of any specific investment. Stated information is derived from proprietary and nonproprietary sources that have not been independently verified for accuracy or completeness. While Passage Global Capital Management, LLC believes the information to be accurate and reliable, we do not claim or have responsibility for its completeness, accuracy, or reliability. Statements of future expectations, estimates, projections, and other forward-looking statements are based on available information and Passage Global Capital Management, LLC’s views as of the time of these statements. Accordingly, such statements are inherently speculative as they are based on assumption that may involve known and unknown risks and uncertainties. Actual results, performance or events may differ materially from those expressed or implied in such statements.

Categories
Uncategorized

Fed’s Predicament

The recent escalation of the U.S. trade disputes with China and Mexico is putting Federal Reserve policymakers in a bind. This comes at a time when global economic growth is losing its momentum, and the effects of President Trump’s tax cuts are wearing off. The International Monetary Fund projected that the current and threatened U.S.-China tariffs could slash global GDP by 0.5% in 2020. This slow-down is most noticeable in the Eurozone and Japan. As for the Chinese economy, the outlook for growth is becoming less certain.

The Fed has held its benchmark rate steady so far this year in a range between 2.25% and 2.50%. However, with risks to the multi-year U.S. expansion rising, Fed officials recently started debating whether and when to cut the rates. They already expect the economy to slow down by 1% to around 2% growth from last year to this year. Any forecast of a sharper-than-expected decline would fuel concerns of recession.


The change in sentiment has already convinced bond investors that a rate cut is likely as bond yields have pushed lower in recent weeks. The 10-year Treasury yield was down to 2.142% at the end of May, and it currently sits well below yields on three-month Treasuries. This represents a so-called yield-curve inversion (Exhibit I) which often precedes rate cuts and recessions as investors prefer to lock in higher rates.

Futures markets provide further evidence that a rate decline is expected. As of the time of this writing, the CME FedWatch tool places about a 25% chance of a 25-basis point rate cut at the Fed’s June meeting and an 80% chance of at least a 25-basis point decline from current levels at their July meeting. The CME FedWatch tool computes probabilities for future interest rate levels based on Fed Funds Futures prices. Market expectations are factored into these prices. As can be seen from Exhibit II, the probabilities of a rate decline have been trending upwards since the start of May with expectations spiking at the end of the month.


Fed policymakers have always had a challenging task. Congress maintains three key objectives for the Federal Reserve: to maximize employment, stabilize prices, and moderate long-term interest rates. For example, the Fed must encourage low unemployment while also monitoring nominal wage increases to make sure that inflation does not grow out of control. They must also ensure that in the long run, interest rates are not too low or too high. And now, the United States is only recently coming out of a period of unprecedented quantitative easing, complicating matters further for current policymakers. The bottom line is this: Fed officials must balance the risks of easing too soon with the costs of waiting too long; and a wrong decision may have far reaching consequences.

The views expressed represent the opinion of Passage Global Capital Management, LLC. The views are subject to change and are not intended as a forecast or guarantee of future results. This material is for informational purposes only. It does not constitute as investment advice and is not intended as an endorsement of any specific investment. Stated information is derived from proprietary and nonproprietary sources that have not been independently verified for accuracy or completeness. While Passage Global Capital Management, LLC believes the information to be accurate and reliable, we do not claim or have responsibility for its completeness, accuracy, or reliability. Statements of future expectations, estimates, projections, and other forward-looking statements are based on available information and Passage Global Capital Management, LLC’s views as of the time of these statements. Accordingly, such statements are inherently speculative as they are based on assumption that may involve known and unknown risks and uncertainties. Actual results, performance or events may differ materially from those expressed or implied in such statements.